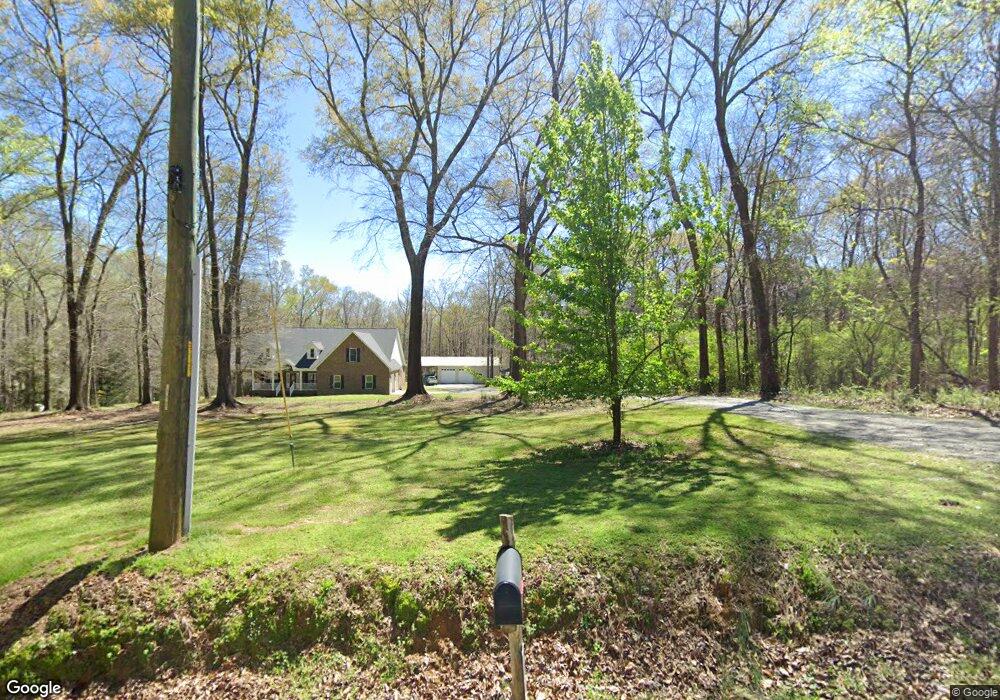
1270 Pa Metts Rd Prosperity, SC 29127
Estimated Value: $152,065 - $340,000
3
Beds
1
Bath
1,254
Sq Ft
$189/Sq Ft
Est. Value
About This Home
This home is located at 1270 Pa Metts Rd, Prosperity, SC 29127 and is currently estimated at $236,766, approximately $188 per square foot. 1270 Pa Metts Rd is a home located in Newberry County with nearby schools including Little Mountain Elementary School, Mid-Carolina Middle School, and Mid-Carolina High School.
Ownership History
Date
Name
Owned For
Owner Type
Purchase Details
Closed on
Nov 11, 2013
Sold by
Hawkins David T and Hawkins Brandon S
Bought by
Hutcherson Van Paul and Hutcherson Diane W
Current Estimated Value
Purchase Details
Closed on
Jun 27, 2012
Sold by
Hawkins Dorothy S
Bought by
Hawkins David T
Purchase Details
Closed on
Jun 26, 2012
Sold by
Hawkins Dorothy S
Bought by
Hawkins David T
Purchase Details
Closed on
Jun 14, 2012
Sold by
Hawkins Lewis Stanley
Bought by
Hawkins Dorothy S
Purchase Details
Closed on
Oct 2, 2007
Sold by
Hawkins Lila L and Grant June H
Bought by
Mills Evelyn H and Mills Kennedy D
Purchase Details
Closed on
Feb 27, 2007
Sold by
Hawkins Lewis Stanely
Bought by
Fulmer Boyd E and Fulmer Dianne H
Purchase Details
Closed on
Jan 4, 2007
Sold by
Hawkins Lila L and Grant June H
Bought by
Hawkins Lewis Stanley
Create a Home Valuation Report for This Property
The Home Valuation Report is an in-depth analysis detailing your home's value as well as a comparison with similar homes in the area
Home Values in the Area
Average Home Value in this Area
Purchase History
| Date | Buyer | Sale Price | Title Company |
|---|---|---|---|
| Hutcherson Van Paul | $57,500 | -- | |
| Hawkins David T | -- | -- | |
| Hawkins Dorothy S | -- | -- | |
| Grant June H | -- | -- | |
| Hawkins David T | -- | -- | |
| Hawkins Dorothy S | -- | -- | |
| Grant June H | -- | -- | |
| Hawkins Dorothy S | -- | -- | |
| Mills Evelyn H | -- | None Available | |
| Grant June H | -- | None Available | |
| Fulmer Boyd E | $28,000 | None Available | |
| Hawkins Lewis Stanley | -- | None Available |
Source: Public Records
Tax History Compared to Growth
Tax History
| Year | Tax Paid | Tax Assessment Tax Assessment Total Assessment is a certain percentage of the fair market value that is determined by local assessors to be the total taxable value of land and additions on the property. | Land | Improvement |
|---|---|---|---|---|
| 2024 | $163 | $2,864 | $624 | $2,240 |
| 2023 | $162 | $2,864 | $624 | $2,240 |
| 2022 | $160 | $2,864 | $624 | $2,240 |
| 2021 | $161 | $2,864 | $624 | $2,240 |
| 2020 | $161 | $2,864 | $624 | $2,240 |
| 2019 | $163 | $2,864 | $624 | $2,240 |
| 2018 | $152 | $2,776 | $492 | $2,284 |
| 2017 | $694 | $2,776 | $492 | $2,284 |
| 2016 | $151 | $2,776 | $492 | $2,284 |
| 2015 | -- | $0 | $0 | $0 |
| 2014 | -- | $4,164 | $0 | $0 |
| 2013 | -- | $2,748 | $0 | $0 |
| 2012 | -- | $2,597 | $0 | $0 |
Source: Public Records
Map
Nearby Homes
- 1176 Whippoorwill Rd
- 529 Glade Springs Rd
- 40 Little Creek Dr
- 0 Evergreen Pass
- 0 Mill Rd
- 532 Pomaria St
- Holy Trinity Church Rd
- 0 Holy Trinity Church Rd
- 371 Holy Trinity Church Rd
- 1249 B/C Holy Trinity Church Rd
- 0 Stewart Landing Dr Unit 618563
- 0 Stewart Landing Dr Unit 597069
- 0 Stewart Landing Dr Unit 597068
- 0 Stewart Landing Dr Unit 597066
- 0 Stewart Landing Dr Unit 597065
- 0 Stewart Landing Dr Unit 597064
- 0 Stewart Landing Dr Unit 596824
- 0 Break Water Dr Unit 604827
- 0 Ferry Phil Ct Unit 604767
- 0 Ferry Phil Ct Unit 604765
- 1295 Pa Metts Rd
- 1224 Pa Metts Rd
- 1176 Pa Metts Rd
- 0 Pa Metts Rd Unit 382136
- 0 Pa Metts Rd Unit 430991
- 0 Pa Metts Rd Unit 431685
- 0 Pa Metts Rd Unit 457929
- 1221 Pa Metts Rd
- 1320 Pa Metts Rd
- 1352 Whippoorwill Rd
- 1181 Whippoorwill Rd
- 1143 Pa Metts Rd
- 566 Mount Pilgrim Church Rd
- 670 Mount Pilgrim Church Rd
- 1184 Whippoorwill Rd
- 1434 Pa Metts Rd
- 671 Mount Pilgrim Church Rd
- 1685 Whippoorwill Rd
- 784 Mount Pilgrim Church Rd
- 978 Pa Metts Rd