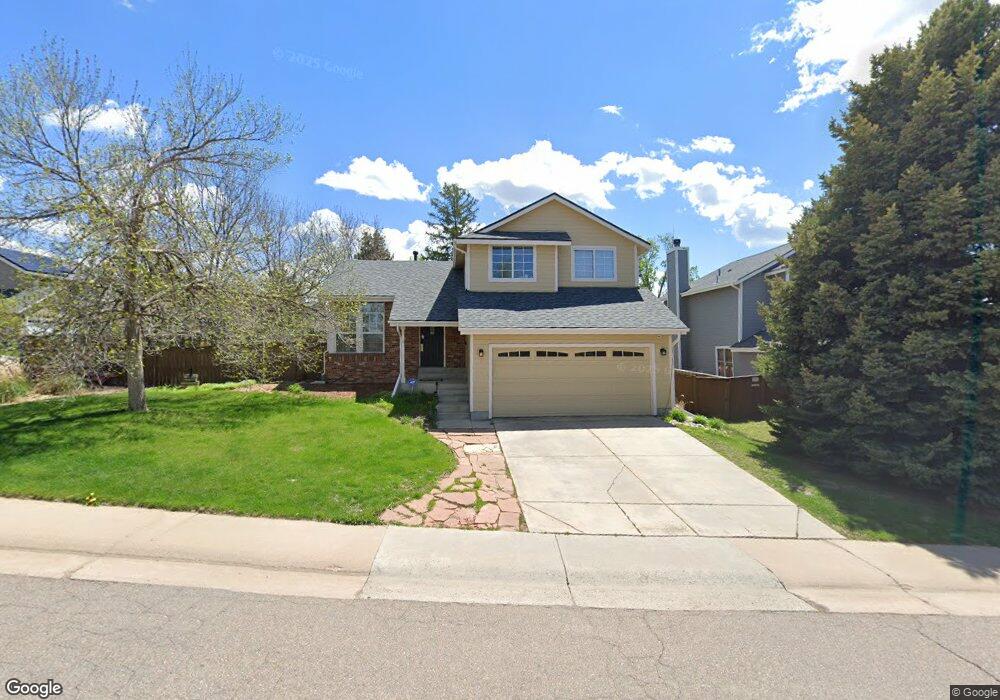
1270 Ridgeglen Way Highlands Ranch, CO 80126
Northridge NeighborhoodEstimated Value: $580,000 - $604,000
3
Beds
3
Baths
1,946
Sq Ft
$304/Sq Ft
Est. Value
About This Home
This home is located at 1270 Ridgeglen Way, Highlands Ranch, CO 80126 and is currently estimated at $590,675, approximately $303 per square foot. 1270 Ridgeglen Way is a home located in Douglas County with nearby schools including Northridge Elementary School, Mountain Ridge Middle School, and Mountain Vista High School.
Ownership History
Date
Name
Owned For
Owner Type
Purchase Details
Closed on
Aug 16, 2021
Sold by
Gerry Chad T and Ceballos Jessi H
Bought by
Gerry Chad T and Gerry Jessi H
Current Estimated Value
Home Financials for this Owner
Home Financials are based on the most recent Mortgage that was taken out on this home.
Original Mortgage
$424,000
Outstanding Balance
$385,547
Interest Rate
2.9%
Mortgage Type
New Conventional
Estimated Equity
$205,128
Purchase Details
Closed on
Aug 8, 2014
Sold by
Yunko Delores D
Bought by
Gerry Chad T and Ceballos Jessi H
Home Financials for this Owner
Home Financials are based on the most recent Mortgage that was taken out on this home.
Original Mortgage
$294,566
Interest Rate
3.75%
Mortgage Type
FHA
Purchase Details
Closed on
Jan 30, 1987
Sold by
Mission Viejo Co
Bought by
Yunko Cindy S
Create a Home Valuation Report for This Property
The Home Valuation Report is an in-depth analysis detailing your home's value as well as a comparison with similar homes in the area
Home Values in the Area
Average Home Value in this Area
Purchase History
| Date | Buyer | Sale Price | Title Company |
|---|---|---|---|
| Gerry Chad T | -- | Avalanche Title & Escrow Inc | |
| Gerry Chad T | $300,000 | Land Title Guarantee Company | |
| Yunko Cindy S | $101,400 | -- |
Source: Public Records
Mortgage History
| Date | Status | Borrower | Loan Amount |
|---|---|---|---|
| Open | Gerry Chad T | $424,000 | |
| Closed | Gerry Chad T | $294,566 |
Source: Public Records
Tax History Compared to Growth
Tax History
| Year | Tax Paid | Tax Assessment Tax Assessment Total Assessment is a certain percentage of the fair market value that is determined by local assessors to be the total taxable value of land and additions on the property. | Land | Improvement |
|---|---|---|---|---|
| 2024 | $3,870 | $44,750 | $10,730 | $34,020 |
| 2023 | $3,863 | $44,750 | $10,730 | $34,020 |
| 2022 | $2,800 | $30,650 | $7,290 | $23,360 |
| 2021 | $2,913 | $30,650 | $7,290 | $23,360 |
| 2020 | $2,679 | $28,890 | $7,050 | $21,840 |
| 2019 | $2,689 | $28,890 | $7,050 | $21,840 |
| 2018 | $2,314 | $24,490 | $6,150 | $18,340 |
| 2017 | $2,107 | $24,490 | $6,150 | $18,340 |
| 2016 | $1,838 | $20,960 | $6,080 | $14,880 |
| 2015 | $1,877 | $20,960 | $6,080 | $14,880 |
| 2014 | $1,551 | $15,990 | $4,340 | $11,650 |
Source: Public Records
Map
Nearby Homes
- 1146 Cherry Blossom Ct
- 1495 Goldsmith Dr
- 715 Myrtlewood Ct
- 772 Ivywood Ct
- 9191 Hickory Cir
- 818 Summer Dr Unit 7D
- 1554 Sunset Ridge Rd
- 745 Stowe St
- 9171 Stargrass Cir
- 1707 Sunset Ridge Rd
- 714 Old Stone Dr
- 8822 Eagles Nest Ln
- 2006 Chelsea Ct
- 283 Saddlewood Cir
- 274 Saddlewood Cir
- 9151 Weatherstone Ct
- 9050 Hunters Creek St
- 507 Fox Hunt Cir
- 9788 Isabel Ct
- 2364 Weatherstone Cir
- 1258 Ridgeglen Way
- 9231 Camelback St
- 9212 Camelback St
- 9241 Camelback St
- 1265 Iris Ct
- 1285 Iris Ct
- 9222 Camelback St
- 1263 Ridgeglen Way
- 1269 Ridgeglen Way
- 1257 Ridgeglen Way
- 9232 Camelback St
- 1275 Ridgeglen Way
- 1286 Iris Ct
- 1251 Ridgeglen Way
- 9251 Camelback St
- 1281 Ridgeglen Way
- 9242 Camelback St
- 1245 Iris Ct
- 1287 Ridgeglen Way
- 1266 Iris Ct