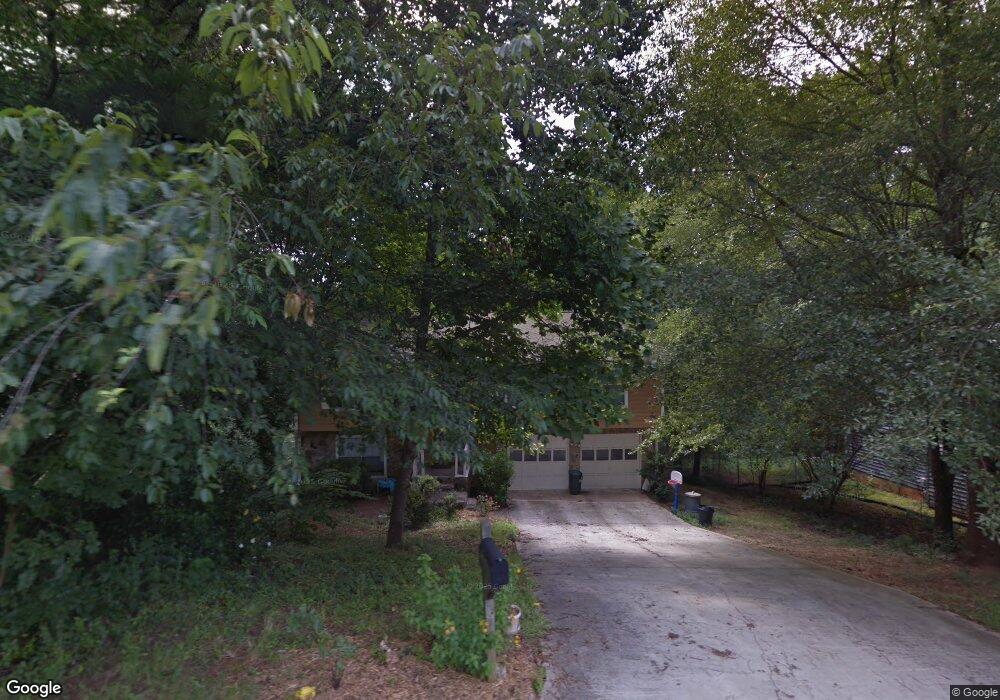
1270 Terramont Dr Unit 4 Roswell, GA 30076
Estimated Value: $351,000 - $441,000
3
Beds
3
Baths
1,296
Sq Ft
$310/Sq Ft
Est. Value
About This Home
This home is located at 1270 Terramont Dr Unit 4, Roswell, GA 30076 and is currently estimated at $401,268, approximately $309 per square foot. 1270 Terramont Dr Unit 4 is a home located in Fulton County with nearby schools including Hillside Elementary School, Haynes Bridge Middle School, and Centennial High School.
Ownership History
Date
Name
Owned For
Owner Type
Purchase Details
Closed on
Feb 23, 2005
Sold by
Winslow Marcus B
Bought by
Kilpatrick Sean O
Current Estimated Value
Home Financials for this Owner
Home Financials are based on the most recent Mortgage that was taken out on this home.
Original Mortgage
$132,800
Outstanding Balance
$67,326
Interest Rate
5.61%
Mortgage Type
New Conventional
Estimated Equity
$333,942
Purchase Details
Closed on
May 28, 1998
Sold by
Shumard Curtis L and Shumard Sandra
Bought by
Winslow Marcus B
Home Financials for this Owner
Home Financials are based on the most recent Mortgage that was taken out on this home.
Original Mortgage
$97,250
Interest Rate
7.23%
Mortgage Type
New Conventional
Purchase Details
Closed on
Feb 26, 1993
Sold by
Tordoff David C Susan M
Bought by
Shumard Curtis L
Home Financials for this Owner
Home Financials are based on the most recent Mortgage that was taken out on this home.
Original Mortgage
$82,450
Interest Rate
7.57%
Create a Home Valuation Report for This Property
The Home Valuation Report is an in-depth analysis detailing your home's value as well as a comparison with similar homes in the area
Home Values in the Area
Average Home Value in this Area
Purchase History
| Date | Buyer | Sale Price | Title Company |
|---|---|---|---|
| Kilpatrick Sean O | $166,000 | -- | |
| Winslow Marcus B | $121,600 | -- | |
| Shumard Curtis L | $86,800 | -- |
Source: Public Records
Mortgage History
| Date | Status | Borrower | Loan Amount |
|---|---|---|---|
| Open | Kilpatrick Sean O | $132,800 | |
| Previous Owner | Winslow Marcus B | $97,250 | |
| Previous Owner | Shumard Curtis L | $82,450 |
Source: Public Records
Tax History Compared to Growth
Tax History
| Year | Tax Paid | Tax Assessment Tax Assessment Total Assessment is a certain percentage of the fair market value that is determined by local assessors to be the total taxable value of land and additions on the property. | Land | Improvement |
|---|---|---|---|---|
| 2025 | $371 | $119,160 | $33,760 | $85,400 |
| 2023 | $371 | $141,160 | $33,760 | $107,400 |
| 2022 | $1,335 | $104,360 | $25,120 | $79,240 |
| 2021 | $1,589 | $96,600 | $19,360 | $77,240 |
| 2020 | $1,611 | $86,960 | $19,960 | $67,000 |
| 2019 | $273 | $85,400 | $19,600 | $65,800 |
| 2018 | $1,643 | $72,760 | $15,640 | $57,120 |
| 2017 | $1,150 | $51,360 | $13,480 | $37,880 |
| 2016 | $1,148 | $51,360 | $13,480 | $37,880 |
| 2015 | $1,433 | $51,360 | $13,480 | $37,880 |
| 2014 | $855 | $40,640 | $16,720 | $23,920 |
Source: Public Records
Map
Nearby Homes
- 1220 Terramont Dr
- 115 Ansley Ct
- 9985 Lake Forest Way
- 1835 Old Alabama Rd
- 1050 Terramont Dr
- 590 Ridgemont Dr
- 620 Lake Forest Ct
- 515 Forest Place
- 650 Lake Forest Ct
- 125 Maison Ct
- 260 Spring Ridge Dr
- 680 Barrington Way
- 420 Little Pines Ct
- 500 Barrington Dr W
- 315 Sea Holly Cir
- 9715 N Pond Cir
- 109 W Ridge Way
- 1280 Terramont Dr
- 1260 Terramont Dr
- 9780 Lake Forest Way
- 1290 Terramont Dr
- 505 Creekwood Crossing E
- 0 Creekwood Crossing E Unit 8766937
- 0 Creekwood Crossing E
- 1265 Terramont Dr
- 9790 Lake Forest Way
- 9790 Lake Forest Way Unit 54
- 100 Creekmont Way Unit 4
- 9760 Lake Forest Way
- 515 Creekwood Crossing E Unit 3
- 1300 Terramont Dr
- 9800 Lake Forest Way
- 1255 Terramont Dr
- 110 Creekmont Way
- 1305 Terramont Dr Unit 4
- 1245 Terramont Dr
- 9810 Lake Forest Way Unit 3