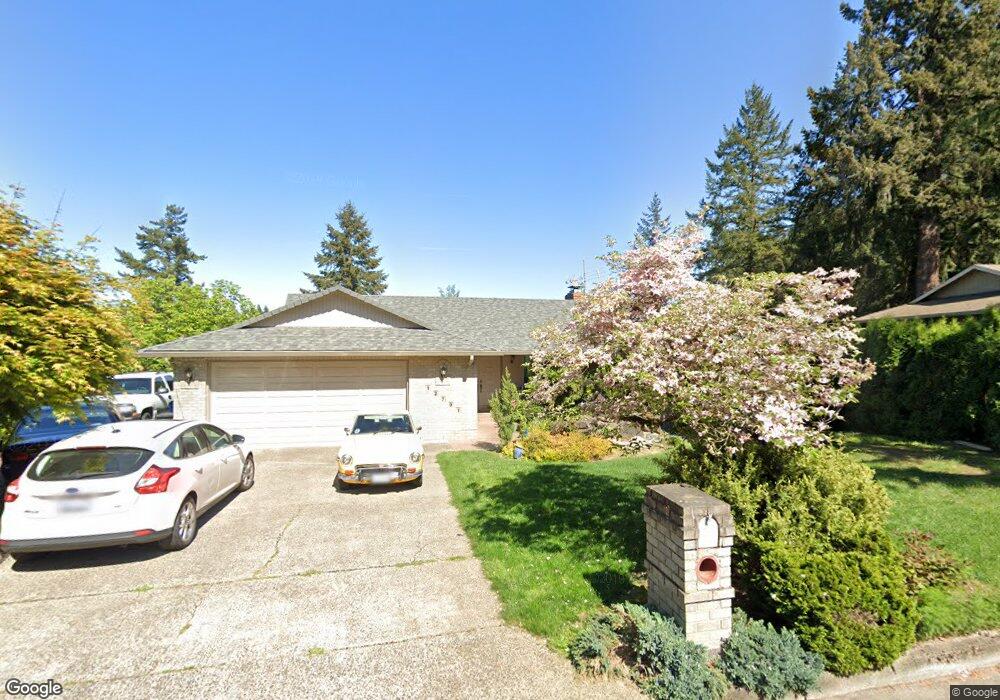
12701 NW 19th Loop Vancouver, WA 98685
Estimated Value: $779,000 - $828,000
4
Beds
3
Baths
3,294
Sq Ft
$243/Sq Ft
Est. Value
About This Home
This home is located at 12701 NW 19th Loop, Vancouver, WA 98685 and is currently estimated at $801,499, approximately $243 per square foot. 12701 NW 19th Loop is a home located in Clark County with nearby schools including Felida Elementary School, Jefferson Middle School, and Skyview High School.
Ownership History
Date
Name
Owned For
Owner Type
Purchase Details
Closed on
Jun 20, 2016
Sold by
Wondrack John S
Bought by
Kolze Gwen A and Kolze Jack A
Current Estimated Value
Home Financials for this Owner
Home Financials are based on the most recent Mortgage that was taken out on this home.
Original Mortgage
$409,500
Outstanding Balance
$326,023
Interest Rate
3.58%
Mortgage Type
New Conventional
Estimated Equity
$475,476
Purchase Details
Closed on
Feb 10, 1997
Sold by
Eckert Gary W and Eckert Rene
Bought by
Wondrack John S and Wondrack Janice G
Home Financials for this Owner
Home Financials are based on the most recent Mortgage that was taken out on this home.
Original Mortgage
$202,100
Interest Rate
6.75%
Purchase Details
Closed on
Jul 12, 1995
Sold by
Black Charles L and Black June P
Bought by
Eckert Gary W and Eckert Rene
Home Financials for this Owner
Home Financials are based on the most recent Mortgage that was taken out on this home.
Original Mortgage
$159,000
Interest Rate
7.59%
Create a Home Valuation Report for This Property
The Home Valuation Report is an in-depth analysis detailing your home's value as well as a comparison with similar homes in the area
Home Values in the Area
Average Home Value in this Area
Purchase History
| Date | Buyer | Sale Price | Title Company |
|---|---|---|---|
| Kolze Gwen A | $455,000 | Chicago Title Fl Vancouver | |
| Wondrack John S | $302,483 | First American Title Co | |
| Eckert Gary W | $248,000 | Chicago Title Insurance Co |
Source: Public Records
Mortgage History
| Date | Status | Borrower | Loan Amount |
|---|---|---|---|
| Open | Kolze Gwen A | $409,500 | |
| Previous Owner | Wondrack John S | $202,100 | |
| Previous Owner | Eckert Gary W | $159,000 |
Source: Public Records
Tax History Compared to Growth
Tax History
| Year | Tax Paid | Tax Assessment Tax Assessment Total Assessment is a certain percentage of the fair market value that is determined by local assessors to be the total taxable value of land and additions on the property. | Land | Improvement |
|---|---|---|---|---|
| 2025 | $7,953 | $819,921 | $343,750 | $476,171 |
| 2024 | $7,356 | $756,347 | $343,750 | $412,597 |
| 2023 | $7,017 | $790,676 | $337,250 | $453,426 |
| 2022 | $6,119 | $716,060 | $337,250 | $378,810 |
| 2021 | $5,945 | $555,688 | $166,100 | $389,588 |
| 2020 | $5,341 | $506,655 | $155,650 | $351,005 |
| 2019 | $5,094 | $483,525 | $155,650 | $327,875 |
| 2018 | $5,650 | $478,940 | $0 | $0 |
| 2017 | $5,140 | $444,069 | $0 | $0 |
| 2016 | $5,036 | $420,872 | $0 | $0 |
| 2015 | $4,915 | $385,746 | $0 | $0 |
| 2014 | -- | $363,449 | $0 | $0 |
| 2013 | -- | $336,064 | $0 | $0 |
Source: Public Records
Map
Nearby Homes
- 12306 NW 17th Ave Unit Lot 30
- 12310 NW 17th Ave
- 12314 NW 17th Ave Unit Lot 28
- 12311 NW 15th Ave
- 12303 NW 17th Ave
- 1701 NW 123rd St
- 2201 NW 128th St
- 1905 NW 123rd St
- The Vail Plan at Ashbury
- Walden Plan at Ashbury
- Lincoln Plan at Ashbury
- Felicity Plan at Ashbury
- Laurelhurst Plan at Ashbury
- Tillamook Plan at Ashbury
- Columbia Plan at Ashbury
- Alder 2306 Plan at Ashbury
- Cannon Plan at Ashbury
- Alki Plan at Ashbury
- Vader Plan at Ashbury
- Woodstock Plan at Ashbury
- 12633 NW 19th Loop
- 12700 NW 19th Loop
- 12717 NW 19th Loop
- 12708 NW 19th Loop
- 12625 NW 19th Loop
- 12619 NW 19th Ave
- 12800 NW 19th Loop
- 12617 NW 19th Loop
- 12705 NW 19th Loop
- 12725 NW 19th Loop
- 12713 NW 19th Loop
- 12306 NW 17th Ave
- 1704 NW 126th St
- 12603 NW 19th Ave
- 12513 NW 17th Ave
- 12803 NW 19th Loop
- 12610 NW 19th Ave
- 12702 NW 19th Loop
- 12706 NW 19th Loop