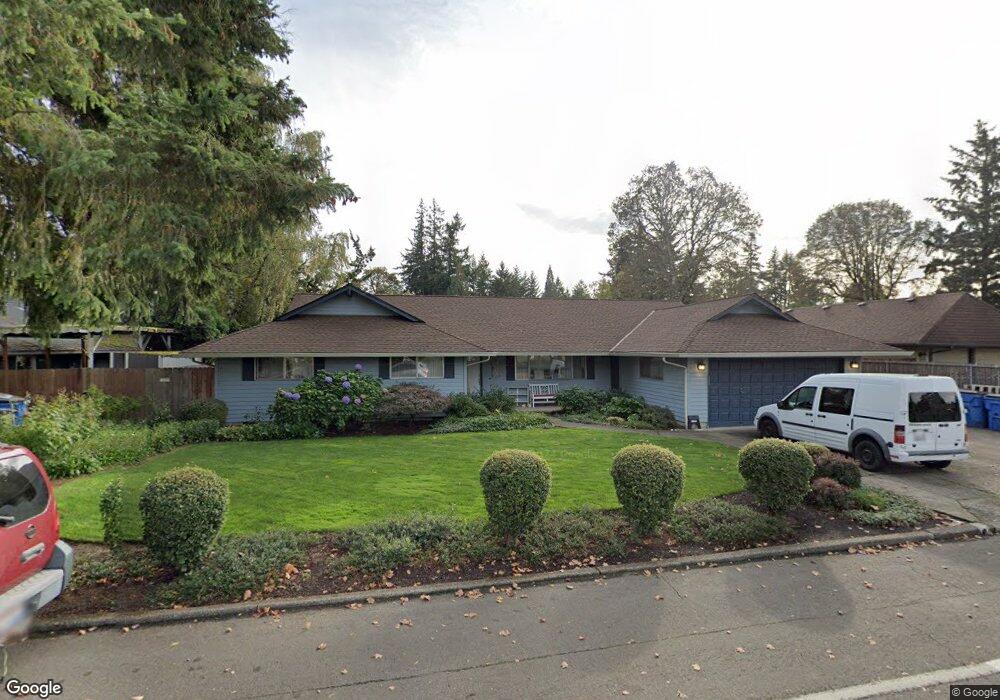
12705 SE McGillivray Blvd Vancouver, WA 98683
Cascade Park NeighborhoodEstimated Value: $524,000 - $607,000
3
Beds
3
Baths
1,850
Sq Ft
$311/Sq Ft
Est. Value
About This Home
This home is located at 12705 SE McGillivray Blvd, Vancouver, WA 98683 and is currently estimated at $574,810, approximately $310 per square foot. 12705 SE McGillivray Blvd is a home located in Clark County with nearby schools including Riverview Elementary School, Wyeast Middle School, and Mountain View High School.
Ownership History
Date
Name
Owned For
Owner Type
Purchase Details
Closed on
Apr 29, 2010
Sold by
Raker Robert C
Bought by
Raker Emily E
Current Estimated Value
Home Financials for this Owner
Home Financials are based on the most recent Mortgage that was taken out on this home.
Original Mortgage
$172,000
Outstanding Balance
$114,662
Interest Rate
4.94%
Mortgage Type
New Conventional
Estimated Equity
$460,148
Purchase Details
Closed on
Sep 1, 1999
Sold by
Bank Of New York
Bought by
Sullivan Deborah S
Home Financials for this Owner
Home Financials are based on the most recent Mortgage that was taken out on this home.
Original Mortgage
$134,000
Interest Rate
7.51%
Purchase Details
Closed on
Jul 19, 1999
Sold by
Hood Gary V
Bought by
Raker Robert C and Raker Emily E
Home Financials for this Owner
Home Financials are based on the most recent Mortgage that was taken out on this home.
Original Mortgage
$134,000
Interest Rate
7.51%
Create a Home Valuation Report for This Property
The Home Valuation Report is an in-depth analysis detailing your home's value as well as a comparison with similar homes in the area
Home Values in the Area
Average Home Value in this Area
Purchase History
| Date | Buyer | Sale Price | Title Company |
|---|---|---|---|
| Raker Emily E | -- | Stewart Title | |
| Sullivan Deborah S | -- | Clark County Title Company | |
| Raker Robert C | $167,500 | Clark County Title |
Source: Public Records
Mortgage History
| Date | Status | Borrower | Loan Amount |
|---|---|---|---|
| Open | Raker Emily E | $172,000 | |
| Previous Owner | Raker Robert C | $134,000 |
Source: Public Records
Tax History Compared to Growth
Tax History
| Year | Tax Paid | Tax Assessment Tax Assessment Total Assessment is a certain percentage of the fair market value that is determined by local assessors to be the total taxable value of land and additions on the property. | Land | Improvement |
|---|---|---|---|---|
| 2025 | $5,305 | $559,430 | $190,000 | $369,430 |
| 2024 | $5,000 | $534,877 | $190,000 | $344,877 |
| 2023 | $5,129 | $522,977 | $197,200 | $325,777 |
| 2022 | $4,503 | $530,071 | $197,200 | $332,871 |
| 2021 | $4,346 | $441,297 | $161,680 | $279,617 |
| 2020 | $4,036 | $402,553 | $138,000 | $264,553 |
| 2019 | $3,713 | $377,349 | $138,000 | $239,349 |
| 2018 | $4,122 | $373,850 | $0 | $0 |
| 2017 | $3,645 | $333,644 | $0 | $0 |
| 2016 | $3,267 | $305,495 | $0 | $0 |
| 2015 | $3,130 | $262,130 | $0 | $0 |
| 2014 | -- | $239,084 | $0 | $0 |
| 2013 | -- | $215,385 | $0 | $0 |
Source: Public Records
Map
Nearby Homes
- 12819 SE Park St
- 1504 SE 125th Ave
- 12601 SE 10th St
- 1614 SE 125th Ave
- 1600 SE 124th Ave
- 1501 SE 121st Ave
- 1218 SE 121st Ave
- 1512 SE 121st Ave
- 12204 SE 7th St
- 13210 SE 7th St Unit A4
- 13210 SE 7th St Unit M60
- 621 SE 121st Ave Unit 32
- 619 SE 121st Ave Unit 23
- 11809 SE 7th St
- 12025 SE 5th St
- 12021 SE 5th St
- 11813 SE 5th St
- 13102 SE 26th St
- 618 SE 141st Ave
- 11306 SE Nancy Rd
- 12619 SE McGillivray Blvd
- 12713 SE McGillivray Blvd
- 12714 SE Park St
- 12710 SE Park St
- 12613 SE McGillivray Blvd
- 12801 SE McGillivray Blvd
- 12718 SE Park St
- 12608 SE Park St
- 12706 SE McGillivray Blvd
- 12712 SE McGillivray Blvd
- 12607 SE McGillivray Blvd
- 12620 SE McGillivray Blvd
- 12805 SE McGillivray Blvd
- 12800 SE McGillivray Blvd
- 12800 SE Park St
- 12604 SE Park St
- 12621 SE Park St
- 12612 SE McGillivray Blvd
- 12613 SE Park St
- 12707 SE Park St