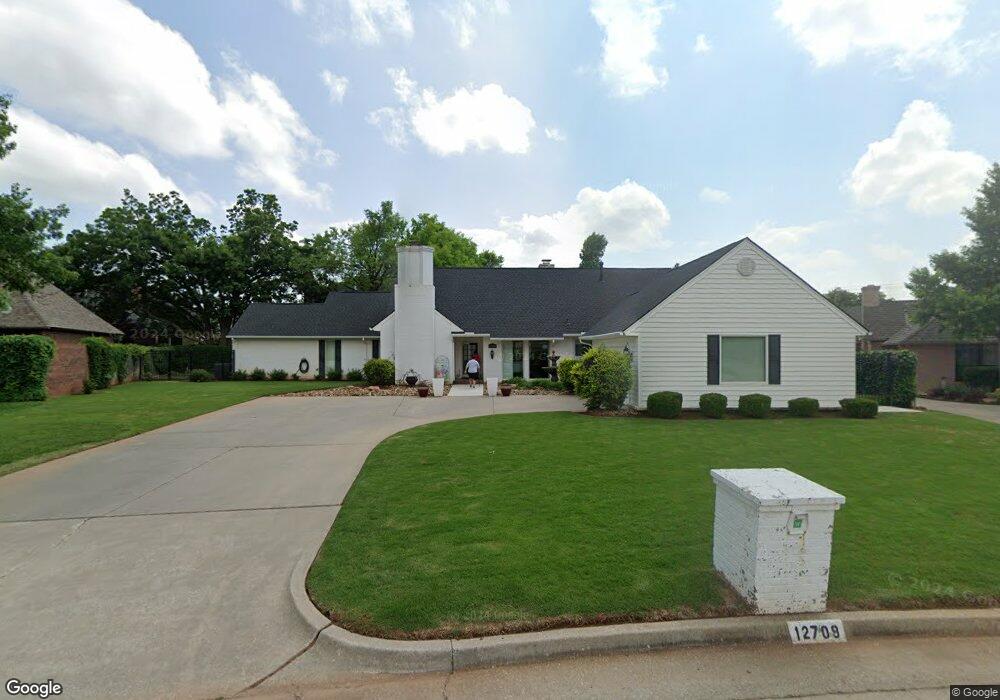
12709 Deerfield Cir Oklahoma City, OK 73142
Val Verde NeighborhoodEstimated Value: $493,864 - $682,000
4
Beds
3
Baths
2,912
Sq Ft
$196/Sq Ft
Est. Value
About This Home
This home is located at 12709 Deerfield Cir, Oklahoma City, OK 73142 and is currently estimated at $570,216, approximately $195 per square foot. 12709 Deerfield Cir is a home located in Oklahoma County with nearby schools including Quail Creek Elementary School, John Marshall Enterprise Middle School, and John Marshall Enterprise High School.
Ownership History
Date
Name
Owned For
Owner Type
Purchase Details
Closed on
Dec 8, 2004
Sold by
Goodwin Deborah
Bought by
Goodwin Deborah and Martinez Sonja P
Current Estimated Value
Purchase Details
Closed on
Aug 27, 2004
Sold by
Roberts Wayne L and Katherine A Roberts Revocable
Bought by
Goodwin Deborah
Purchase Details
Closed on
Dec 10, 2002
Sold by
Roberts Wayne L and Roberts Katherine A
Bought by
Wayne L & Katherine A Roberts Revocable
Purchase Details
Closed on
Dec 3, 2002
Sold by
Wayne L & Katherine Roberts Revocable Li
Bought by
Roberts Wayne L and Roberts Katherine A
Purchase Details
Closed on
Jun 27, 2001
Sold by
Roberts Wayne L and Roberts Katherine A
Bought by
Wayne L & Katherine A Roberts Revocable
Purchase Details
Closed on
Jun 13, 2001
Sold by
Manners Donald R and Manners Sheila C
Bought by
Roberts Wayne L and Roberts Katherine A
Create a Home Valuation Report for This Property
The Home Valuation Report is an in-depth analysis detailing your home's value as well as a comparison with similar homes in the area
Home Values in the Area
Average Home Value in this Area
Purchase History
| Date | Buyer | Sale Price | Title Company |
|---|---|---|---|
| Goodwin Deborah | -- | -- | |
| Goodwin Deborah | $330,000 | American Guaranty Title Co | |
| Wayne L & Katherine A Roberts Revocable | -- | American Guaranty Title Co | |
| Roberts Wayne L | -- | American Guaranty Title Co | |
| Wayne L & Katherine A Roberts Revocable | -- | American Guaranty Title Co | |
| Roberts Wayne L | $270,500 | American Guaranty Title Co |
Source: Public Records
Tax History Compared to Growth
Tax History
| Year | Tax Paid | Tax Assessment Tax Assessment Total Assessment is a certain percentage of the fair market value that is determined by local assessors to be the total taxable value of land and additions on the property. | Land | Improvement |
|---|---|---|---|---|
| 2024 | $4,823 | $41,473 | $7,582 | $33,891 |
| 2023 | $4,823 | $40,266 | $7,886 | $32,380 |
| 2022 | $4,481 | $39,093 | $8,733 | $30,360 |
| 2021 | $4,350 | $37,955 | $8,595 | $29,360 |
| 2020 | $4,269 | $36,850 | $9,229 | $27,621 |
| 2019 | $4,502 | $38,830 | $9,229 | $29,601 |
| 2018 | $4,273 | $38,665 | $0 | $0 |
| 2017 | $4,413 | $39,929 | $8,916 | $31,013 |
| 2016 | $4,528 | $40,919 | $8,916 | $32,003 |
| 2015 | $4,652 | $41,630 | $8,916 | $32,714 |
| 2014 | $4,626 | $41,636 | $8,916 | $32,720 |
Source: Public Records
Map
Nearby Homes
- 5001 Misty Glen Cir
- 12701 Downsview Ln
- 5309 NW 123rd St
- 12308 Val Verde Dr
- 12300 St Lukes Ln
- 12220 Banyan Ln
- 12300 Maiden Ln
- 5612 NW 126th St
- 5632 NW 126th St
- 12216 Cork Rd
- 13009 Jasmine Ln
- 5509 NW 121st St
- 4704 Hemlock Ln
- 4702 Hemlock Ln
- 5509 NW 120th St
- 4436 Tamarisk Dr
- 13201 Turtle Pond Ct
- 12909 Saint Christopher Dr
- 4428 Day Lilly Ln
- 5609 NW 130th St
- 5025 Barnsteeple Ct
- 12705 Deerfield Cir
- 12713 Deerfield Cir
- 5017 Barnsteeple Ct
- 5033 Barnsteeple Ct
- 12708 Deerfield Cir
- 12701 Deerfield Cir
- 5009 Barnsteeple Ct
- 12805 Val Verde Dr
- 12800 Deerfield Cir
- 5001 Barnsteeple Ct
- 12805 Deerfield Cir
- 5200 NW 126th Ct
- 5048 Barnsteeple Ct
- 5040 Barnsteeple Ct
- 12716 Downsview Ln
- 5032 Barnsteeple Ct
- 12809 Val Verde Dr
- 12700 Downsview Ln
- 12809 Deerfield Cir