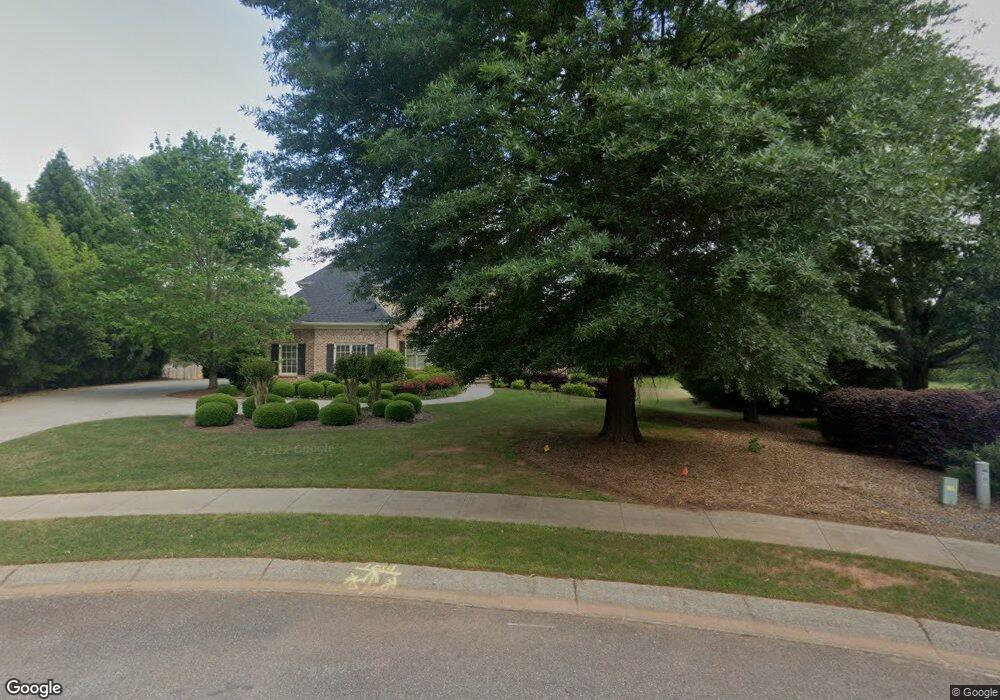
1271 Hammond Creek Trail Bogart, GA 30622
Estimated Value: $855,702 - $1,080,000
--
Bed
--
Bath
3,320
Sq Ft
$281/Sq Ft
Est. Value
About This Home
This home is located at 1271 Hammond Creek Trail, Bogart, GA 30622 and is currently estimated at $932,926, approximately $281 per square foot. 1271 Hammond Creek Trail is a home located in Oconee County with nearby schools including Malcom Bridge Elementary School, Malcom Bridge Middle School, and North Oconee High School.
Ownership History
Date
Name
Owned For
Owner Type
Purchase Details
Closed on
Nov 3, 2021
Sold by
Thurmond Kasi F
Bought by
Ciotti Kyle and Ciotti Sara Ham
Current Estimated Value
Home Financials for this Owner
Home Financials are based on the most recent Mortgage that was taken out on this home.
Original Mortgage
$485,000
Outstanding Balance
$441,499
Interest Rate
2.99%
Mortgage Type
New Conventional
Estimated Equity
$491,427
Purchase Details
Closed on
Feb 6, 2020
Sold by
Mcclellan William Kirk
Bought by
Thurmond Scotty G
Purchase Details
Closed on
Jul 11, 2012
Sold by
Thurmond Kasi F
Bought by
Thurmond Kasi F and Kasi F Thurmond Trust
Purchase Details
Closed on
Dec 17, 2003
Sold by
Thurmond Scotty G
Bought by
Thurmond Kasi F
Purchase Details
Closed on
Jun 5, 2003
Sold by
S and G
Bought by
Thurmond Scotty G
Purchase Details
Closed on
Apr 15, 2003
Sold by
Rjc Land Development Inc
Bought by
Sg Thurmond Construction Inc
Create a Home Valuation Report for This Property
The Home Valuation Report is an in-depth analysis detailing your home's value as well as a comparison with similar homes in the area
Home Values in the Area
Average Home Value in this Area
Purchase History
| Date | Buyer | Sale Price | Title Company |
|---|---|---|---|
| Ciotti Kyle | $680,000 | -- | |
| Thurmond Scotty G | $220,000 | -- | |
| Thurmond Kasi F | -- | -- | |
| Thurmond Kasi F | -- | -- | |
| Thurmond Scotty G | -- | -- | |
| Sg Thurmond Construction Inc | $75,000 | -- |
Source: Public Records
Mortgage History
| Date | Status | Borrower | Loan Amount |
|---|---|---|---|
| Open | Ciotti Kyle | $485,000 |
Source: Public Records
Tax History Compared to Growth
Tax History
| Year | Tax Paid | Tax Assessment Tax Assessment Total Assessment is a certain percentage of the fair market value that is determined by local assessors to be the total taxable value of land and additions on the property. | Land | Improvement |
|---|---|---|---|---|
| 2024 | $6,340 | $286,834 | $36,000 | $250,834 |
| 2023 | $5,364 | $267,301 | $28,000 | $239,301 |
| 2022 | $5,155 | $240,314 | $28,000 | $212,314 |
| 2021 | $5,143 | $222,322 | $28,000 | $194,322 |
| 2020 | $4,926 | $212,627 | $28,000 | $184,627 |
| 2019 | $4,836 | $208,756 | $28,000 | $180,756 |
| 2018 | $4,768 | $201,534 | $28,000 | $173,534 |
| 2017 | $4,666 | $197,228 | $28,000 | $169,228 |
Source: Public Records
Map
Nearby Homes
- 1336 Prince Place
- 1010 Long Creek Dr
- 1190 Wareview Ct
- 1071 Oaklake Cir
- 1941 Mars Hill Rd
- 1120 Lancaster Ct
- 1031 Sagefield Dr
- 0 Mars Hill Rd Unit 1025421
- 0 Mars Hill Rd Unit 10509287
- 1479 Mcfall Ct
- 1010 Oaklake Terrace
- 3131 Rocky Branch Rd Unit 140
- 3131 Rocky Branch Rd Unit 280
- 1070 Sagefield Dr
- 1061 Bent Creek Rd
- 1895 Vintage Place
- 1300 Manjula Ln
- 1100 Manjula Ln
- 1271 Hammond Creek Trail
- 1261 Hammond Creek Trail
- 1011 Waverly Meadow Ln
- 1011 Waverly Meadow Ln
- 1011 Joie Dr
- 1031 Waverly Meadow Ln
- 1021 Joie Dr
- 1011 Joie Dr
- 1251 Hammond Creek Trail
- 1251 Hammond Creek Trail
- 1031 Joie Dr
- 1250 Hammond Creek Trail
- 1250 Hammond Creek Trail
- 1031 Joie Dr
- 1030 Waverly Meadow Ln
- 1030 Waverly Meadow Ln
- 1041 Joie Dr
- 1010 Joie Dr
- 0 Old Creek Way
- 1020 Joie Dr