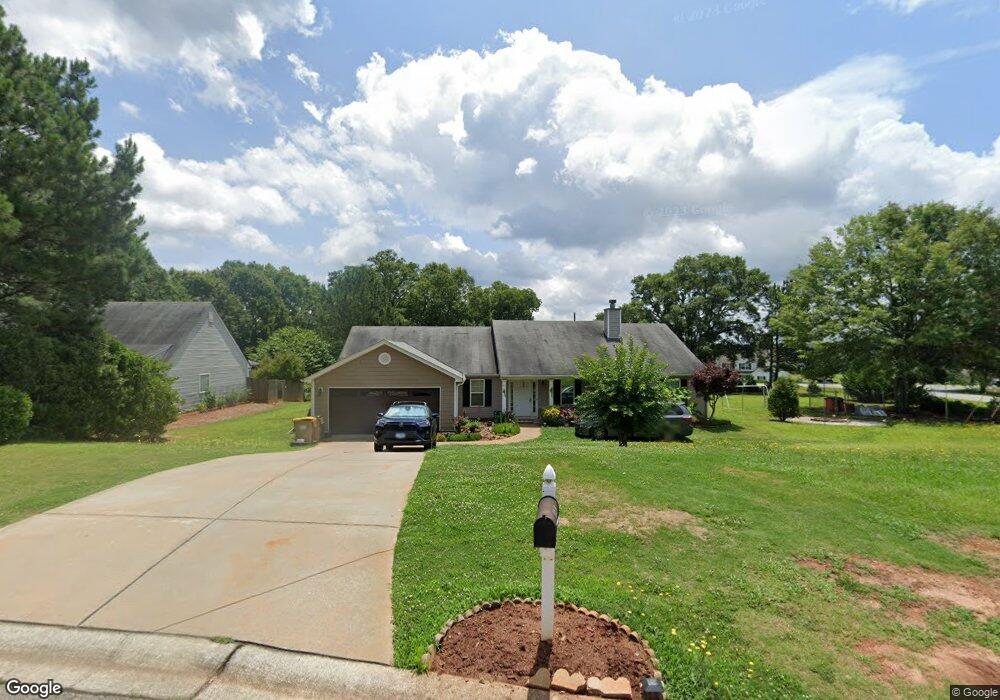
1271 Walnut Dr Winder, GA 30680
Estimated Value: $330,725 - $390,000
4
Beds
3
Baths
2,106
Sq Ft
$168/Sq Ft
Est. Value
About This Home
This home is located at 1271 Walnut Dr, Winder, GA 30680 and is currently estimated at $354,431, approximately $168 per square foot. 1271 Walnut Dr is a home located in Barrow County with nearby schools including Holsenbeck Elementary School, Bear Creek Middle School, and Winder-Barrow High School.
Ownership History
Date
Name
Owned For
Owner Type
Purchase Details
Closed on
Jun 10, 2010
Sold by
Hud-Housing Of Urban Dev
Bought by
Ocana William S T
Current Estimated Value
Home Financials for this Owner
Home Financials are based on the most recent Mortgage that was taken out on this home.
Original Mortgage
$124,642
Outstanding Balance
$83,717
Interest Rate
5.25%
Mortgage Type
FHA
Estimated Equity
$270,714
Purchase Details
Closed on
Dec 1, 2009
Sold by
Wells Fargo Bk Na
Bought by
Hud-Housing Of Urban Dev
Purchase Details
Closed on
Aug 3, 2007
Sold by
Paradigm Const Co
Bought by
Clay Melinda and Clay William A
Home Financials for this Owner
Home Financials are based on the most recent Mortgage that was taken out on this home.
Original Mortgage
$137,610
Interest Rate
9.55%
Mortgage Type
New Conventional
Purchase Details
Closed on
Jan 19, 2007
Sold by
Genpro Properties Llc
Bought by
Paradigm Construction Co
Purchase Details
Closed on
Jun 17, 2005
Sold by
Warren Robert L
Bought by
Genpro Properties Llc
Create a Home Valuation Report for This Property
The Home Valuation Report is an in-depth analysis detailing your home's value as well as a comparison with similar homes in the area
Home Values in the Area
Average Home Value in this Area
Purchase History
| Date | Buyer | Sale Price | Title Company |
|---|---|---|---|
| Ocana William S T | -- | -- | |
| Hud-Housing Of Urban Dev | -- | -- | |
| Wells Fargo Bk Na | $151,843 | -- | |
| Clay Melinda | $152,900 | -- | |
| Paradigm Construction Co | $39,500 | -- | |
| Genpro Properties Llc | $374,000 | -- |
Source: Public Records
Mortgage History
| Date | Status | Borrower | Loan Amount |
|---|---|---|---|
| Open | Ocana William S T | $124,642 | |
| Previous Owner | Clay Melinda | $137,610 |
Source: Public Records
Tax History
| Year | Tax Paid | Tax Assessment Tax Assessment Total Assessment is a certain percentage of the fair market value that is determined by local assessors to be the total taxable value of land and additions on the property. | Land | Improvement |
|---|---|---|---|---|
| 2025 | $2,647 | $113,614 | $16,000 | $97,614 |
| 2024 | $2,767 | $110,726 | $16,000 | $94,726 |
| 2023 | $2,363 | $111,126 | $16,000 | $95,126 |
| 2022 | $2,042 | $70,386 | $16,000 | $54,386 |
| 2021 | $2,148 | $70,386 | $16,000 | $54,386 |
| 2020 | $2,147 | $70,386 | $16,000 | $54,386 |
| 2019 | $2,183 | $70,386 | $16,000 | $54,386 |
| 2018 | $1,860 | $60,557 | $13,200 | $47,357 |
| 2017 | $1,550 | $53,234 | $13,200 | $40,034 |
| 2016 | $1,550 | $51,661 | $13,200 | $38,461 |
| 2015 | $1,569 | $52,070 | $13,200 | $38,870 |
| 2014 | -- | $47,022 | $7,742 | $39,280 |
| 2013 | -- | $44,122 | $7,742 | $36,380 |
Source: Public Records
Map
Nearby Homes
- 917 Justin Dr Unit 3
- 614 Anns Way
- 388 Kay Dr Unit 1
- 1553 Shoal Creek Dr
- 1556 Shoal Creek Dr
- 973 Vera Ct
- 56 Candler Park Ct
- 508 Pleasant Hill Church Rd NE
- 16 Fox Dr
- 385 Finch Landing Rd
- 246 Pleasant Hill Church Rd NE
- 63 Delightful Way Unit 1
- 1453 Solomon Dr
- 162 Delightful Way Unit 28
- 253 Delightful Way Unit 6
- 230 Delightful Way Unit 23
- 281 Delightful Way Unit 7
- 698 Melinda Dr
- 296 Delightful Way Unit 22
- 315 Paige Way
- 1273 Walnut Dr
- 1274 Walnut Dr
- 1038 Cook Rd
- 1023 Cook Rd
- 1276 Walnut Dr
- 501 Cherokee Rd
- 1195 Highway 211 NE
- 1279 Walnut Dr
- 1189 Georgia Highway 211
- 1189 Highway 211 NE
- 943 Justin Dr
- 1278 Walnut Dr
- 1183 Highway 211 NE
- 944 Justin Dr
- 500 Cherokee Rd
- 1176 Highway 211 NE
- 941 Justin Dr Unit 3
- 1195 Georgia Highway 211
- 1280 Walnut Dr
- 1281 Walnut Dr
Your Personal Tour Guide
Ask me questions while you tour the home.