
Landlord's Agent in 2024
Jessica Composto
Tradewind Properties
(763) 657-1957
2 in this area
58 Total Sales
Estimated Value: $282,366 - $359,000
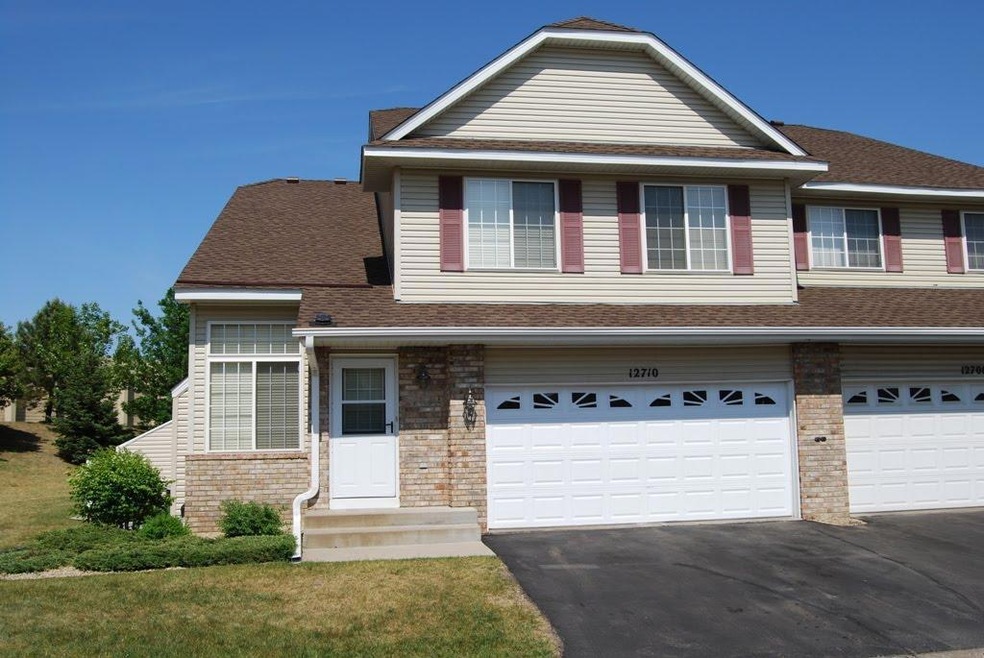
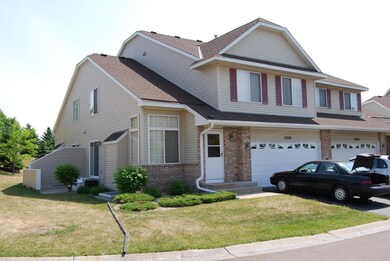
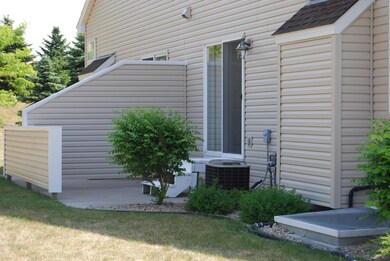
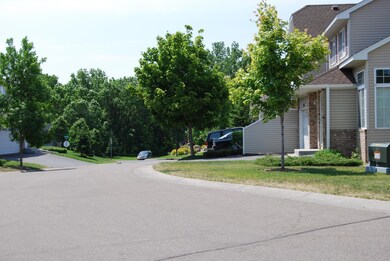
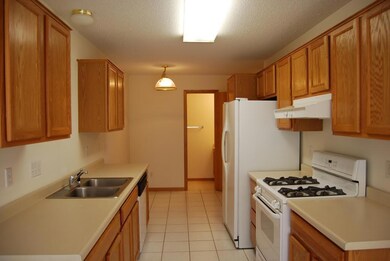
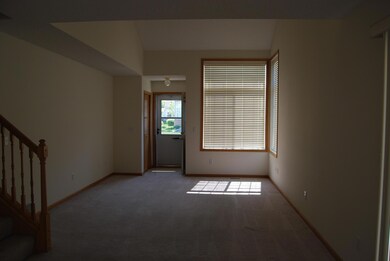
This 2 bed, 2.5 bath end unit TH will not last long! High demand Cedar Ponds HOA close to everything Maple Grove has to offer. Upon entering you’ll be welcomed into a bright and airy living room that leads to the dining and walk-out patio. Spacious kit w/ additional space for a table. Main floor is complete with 1⁄2 bath and 2 car attached garage access. LL bsmt is finished and perfect for additional living space, rec area or storage and has a dedicated 3⁄4 bath. Upper level features both bedss along with additional loft space overlooking the LR. Master bedroom is complete with walk-in closet and walk-thru bath. Available June 15th with 12 mos lease. Tenant pays gas and electric. 2 cats or 1 dog under 25 lbs allowed with $400 refundable pet deposit and $50/month per pet pet rent. No aggressive breeds or puppies. Every pet/animal must go through prof screening process and app, additional fee applies. Renters ins required. Sec 8 not approved. $45/adult app fee. Min 24 hr notice to show.
| Date | Buyer | Sale Price | Title Company |
|---|---|---|---|
| Gm Homes Inc | $30,000 | -- | |
| Pande Shashank A | $138,463 | -- |
| Date | Event | Price | List to Sale | Price per Sq Ft |
|---|---|---|---|---|
| 06/15/2024 06/15/24 | Rented | $2,000 | 0.0% | -- |
| 06/02/2024 06/02/24 | Off Market | $2,000 | -- | -- |
| 05/30/2024 05/30/24 | For Rent | $2,000 | 0.0% | -- |
| 05/16/2024 05/16/24 | Off Market | $2,000 | -- | -- |
| 05/08/2024 05/08/24 | For Rent | $2,000 | -- | -- |
| Year | Tax Paid | Tax Assessment Tax Assessment Total Assessment is a certain percentage of the fair market value that is determined by local assessors to be the total taxable value of land and additions on the property. | Land | Improvement |
|---|---|---|---|---|
| 2024 | $3,421 | $280,400 | $77,400 | $203,000 |
| 2023 | $3,203 | $272,800 | $70,300 | $202,500 |
| 2022 | $2,926 | $275,400 | $62,500 | $212,900 |
| 2021 | $2,774 | $240,600 | $52,300 | $188,300 |
| 2020 | $2,716 | $223,400 | $41,000 | $182,400 |
| 2019 | $2,726 | $209,000 | $38,700 | $170,300 |
| 2018 | $2,614 | $197,900 | $39,400 | $158,500 |
| 2017 | $2,548 | $174,100 | $37,500 | $136,600 |
| 2016 | $2,342 | $157,600 | $26,500 | $131,100 |
| 2015 | $2,426 | $158,700 | $38,000 | $120,700 |
| 2014 | -- | $138,700 | $30,000 | $108,700 |
Landlord's Agent in 2024
Jessica Composto
Tradewind Properties
(763) 657-1957
2 in this area
58 Total Sales
Source: NorthstarMLS
MLS Number: 6532234
APN: 26-119-22-23-0096
Disclaimer: Certain information contained herein is derived from information provided by parties other than Homes.com. All information provided is deemed reliable, but is not guaranteed to be accurate and should be independently verified.
![]() Based on information submitted to the MLS GRID. All data is obtained from various sources and may not have been verified by broker or MLS GRID. Supplied Open House Information is subject to change without notice. All information should be independently reviewed and verified for accuracy. Properties may or may not be listed by the office/agent presenting the information. Some IDX listings have been excluded from this website.
Based on information submitted to the MLS GRID. All data is obtained from various sources and may not have been verified by broker or MLS GRID. Supplied Open House Information is subject to change without notice. All information should be independently reviewed and verified for accuracy. Properties may or may not be listed by the office/agent presenting the information. Some IDX listings have been excluded from this website.
The Digital Millennium Copyright Act of 1998, 17 U.S.C. § 512 (the “DMCA”) provides recourse for copyright owners who believe that material appearing on the Internet infringes their rights under U.S. copyright law. If you believe in good faith that any content or material made available in connection with our website or services infringes your copyright, you (or your agent) may send us a notice requesting that the content or material be removed, or access to it blocked.
Notices must be sent in writing by email to DMCAnotice@MLSGrid.com.
The DMCA requires that your notice of alleged copyright infringement include the following information:
(1) description of the copyrighted work that is the subject of claimed infringement;
(2) description of the alleged infringing content and information sufficient to permit us to locate the content;
(3) contact information for you, including your address, telephone number and email address;
(4) a statement by you that you have a good faith belief that the content in the manner complained of is not authorized by the copyright owner, or its agent, or by the operation of any law;
(5) a statement by you, signed under penalty of perjury, that the information in the notification is accurate and that you have the authority to enforce the copyrights that are claimed to be infringed; and
(6) a physical or electronic signature of the copyright owner or a person authorized to act on the copyright owner’s behalf. Failure to include all of the above information may result in the delay of the processing of your complaint.