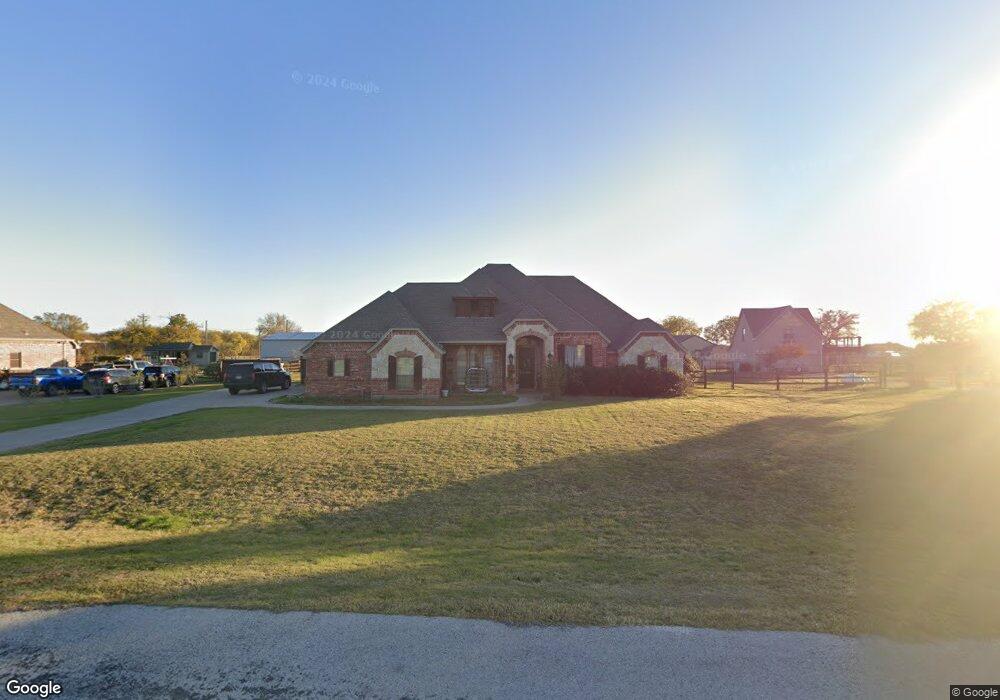
12711 Helen Rd Justin, TX 76247
Estimated Value: $719,409 - $747,000
3
Beds
3
Baths
3,028
Sq Ft
$243/Sq Ft
Est. Value
About This Home
This home is located at 12711 Helen Rd, Justin, TX 76247 and is currently estimated at $735,102, approximately $242 per square foot. 12711 Helen Rd is a home located in Denton County with nearby schools including Gene Pike Middle School and Northwest High School.
Ownership History
Date
Name
Owned For
Owner Type
Purchase Details
Closed on
Jul 2, 2012
Sold by
Mcmickle Jeff and Mcmickle Traci
Bought by
Shahan Kristyn
Current Estimated Value
Home Financials for this Owner
Home Financials are based on the most recent Mortgage that was taken out on this home.
Original Mortgage
$296,400
Outstanding Balance
$205,952
Interest Rate
3.81%
Mortgage Type
New Conventional
Estimated Equity
$529,150
Purchase Details
Closed on
Oct 3, 2008
Sold by
S C C Homes Ltd
Bought by
Mcmickle Jeff
Home Financials for this Owner
Home Financials are based on the most recent Mortgage that was taken out on this home.
Original Mortgage
$45,300
Interest Rate
6.35%
Mortgage Type
Stand Alone Second
Purchase Details
Closed on
Aug 14, 2006
Sold by
Avondale Ranch Ltd
Bought by
S C C Homes Ltd
Home Financials for this Owner
Home Financials are based on the most recent Mortgage that was taken out on this home.
Original Mortgage
$197,000
Interest Rate
6.77%
Mortgage Type
Purchase Money Mortgage
Create a Home Valuation Report for This Property
The Home Valuation Report is an in-depth analysis detailing your home's value as well as a comparison with similar homes in the area
Home Values in the Area
Average Home Value in this Area
Purchase History
| Date | Buyer | Sale Price | Title Company |
|---|---|---|---|
| Shahan Kristyn | -- | Rtt | |
| Mcmickle Jeff | -- | Sendera Title | |
| S C C Homes Ltd | -- | None Available |
Source: Public Records
Mortgage History
| Date | Status | Borrower | Loan Amount |
|---|---|---|---|
| Open | Shahan Kristyn | $296,400 | |
| Previous Owner | Mcmickle Jeff | $45,300 | |
| Previous Owner | Mcmickle Jeff | $241,600 | |
| Previous Owner | S C C Homes Ltd | $197,000 |
Source: Public Records
Tax History Compared to Growth
Tax History
| Year | Tax Paid | Tax Assessment Tax Assessment Total Assessment is a certain percentage of the fair market value that is determined by local assessors to be the total taxable value of land and additions on the property. | Land | Improvement |
|---|---|---|---|---|
| 2025 | $7,176 | $699,808 | $175,547 | $538,762 |
| 2024 | $8,307 | $636,189 | $0 | $0 |
| 2023 | $6,298 | $578,354 | $175,547 | $532,264 |
| 2022 | $7,845 | $525,776 | $98,745 | $460,722 |
| 2021 | $8,084 | $477,978 | $98,745 | $379,233 |
| 2020 | $7,358 | $447,209 | $98,745 | $348,464 |
| 2019 | $8,016 | $467,234 | $98,745 | $368,489 |
| 2018 | $7,523 | $435,424 | $87,774 | $347,650 |
| 2017 | $6,924 | $407,091 | $87,774 | $319,961 |
| 2016 | $6,295 | $370,083 | $54,858 | $315,225 |
| 2015 | $5,305 | $347,408 | $54,858 | $292,550 |
| 2014 | $5,305 | $320,207 | $41,568 | $278,639 |
| 2013 | -- | $307,905 | $41,568 | $266,337 |
Source: Public Records
Map
Nearby Homes
- 13840 Melissa Ct
- 13830 Melissa Ct
- 13801 Melissa Ct
- 13861 James Ranch Ct
- 14792 Sam Reynolds Rd
- 8417 Peach St
- 8408 Peach St
- 8413 Acorn Ave
- 8417 Acorn Ave
- Laurel Plan at Treeline - Cottage
- Juniper Plan at Treeline - Cottage
- Magnolia Plan at Treeline - Cottage
- Hazel Plan at Treeline - Cottage
- Holly Plan at Treeline - Cottage
- Willow Plan at Treeline - Cottage
- Aspen Plan at Treeline - Cottage
- 18047 Bruno Rd
- Kendall Plan at Wildflower Ranch
- Rotan Plan at Wildflower Ranch - Select Collection
- Dakota Plan at Wildflower Ranch
- 12701 Helen Rd
- 12721 Helen Rd
- 12700 Helen Rd
- 12710 Helen Rd
- 12731 Helen Rd
- 13831 Melissa Ct
- 12720 Helen Rd
- 13821 Melissa Ct
- 13820 Melissa Ct
- 13850 Megan Dr
- 13880 Megan Dr
- 13870 Megan Dr
- 13860 Megan Dr
- 12740 Helen Rd
- 13811 Melissa Ct
- 13839 Sam Reynolds Rd
- 13840 Megan Dr
- 13881 Megan Dr
- 13871 Megan Dr
- 13861 Megan Dr