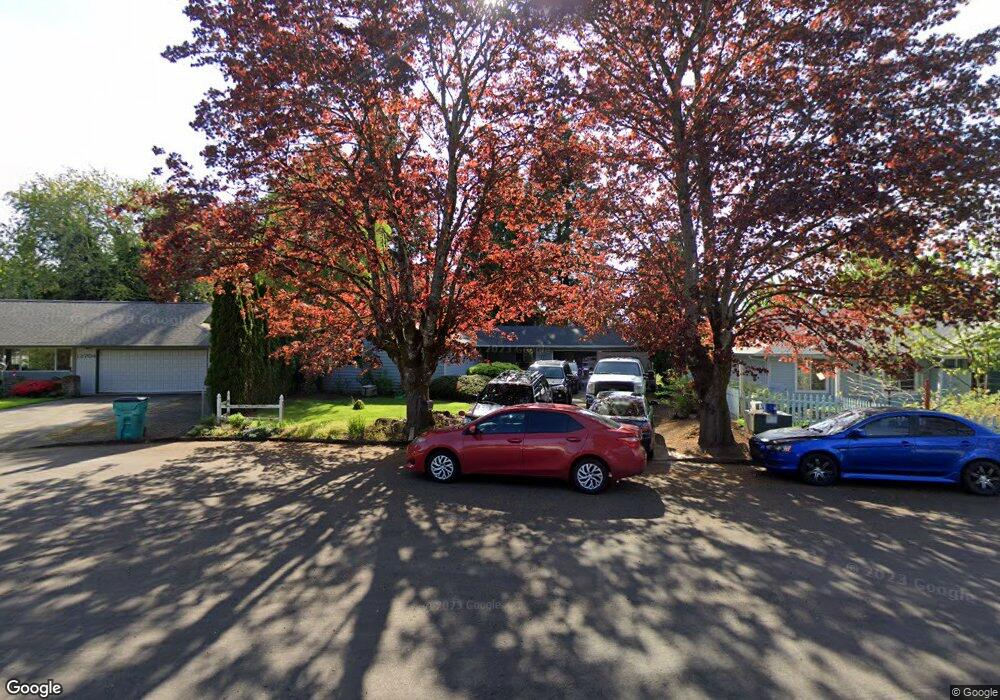
12712 NW 35th Ave Vancouver, WA 98685
Estimated Value: $469,000 - $544,000
3
Beds
2
Baths
1,216
Sq Ft
$411/Sq Ft
Est. Value
About This Home
This home is located at 12712 NW 35th Ave, Vancouver, WA 98685 and is currently estimated at $499,504, approximately $410 per square foot. 12712 NW 35th Ave is a home located in Clark County with nearby schools including Felida Elementary School, Jefferson Middle School, and Skyview High School.
Ownership History
Date
Name
Owned For
Owner Type
Purchase Details
Closed on
Sep 5, 2023
Sold by
Santic Rodney A and Santic Crystal J
Bought by
Santic Revocable Trust and Santic
Current Estimated Value
Purchase Details
Closed on
Jun 22, 2005
Sold by
Duquette Richard J and Whitworth Jana L
Bought by
Santic Rod A and Santic Crystal
Home Financials for this Owner
Home Financials are based on the most recent Mortgage that was taken out on this home.
Original Mortgage
$152,000
Interest Rate
1.37%
Mortgage Type
Negative Amortization
Purchase Details
Closed on
Aug 19, 1998
Sold by
Boyesen Barbara C
Bought by
Duquette Richard J and Whitworth Jana L
Home Financials for this Owner
Home Financials are based on the most recent Mortgage that was taken out on this home.
Original Mortgage
$96,000
Interest Rate
6.93%
Create a Home Valuation Report for This Property
The Home Valuation Report is an in-depth analysis detailing your home's value as well as a comparison with similar homes in the area
Home Values in the Area
Average Home Value in this Area
Purchase History
| Date | Buyer | Sale Price | Title Company |
|---|---|---|---|
| Santic Revocable Trust | -- | None Listed On Document | |
| Santic Rod A | $190,000 | First American Title | |
| Duquette Richard J | $120,000 | Chicago Title Insurance Co |
Source: Public Records
Mortgage History
| Date | Status | Borrower | Loan Amount |
|---|---|---|---|
| Previous Owner | Santic Rod A | $152,000 | |
| Previous Owner | Duquette Richard J | $96,000 |
Source: Public Records
Tax History Compared to Growth
Tax History
| Year | Tax Paid | Tax Assessment Tax Assessment Total Assessment is a certain percentage of the fair market value that is determined by local assessors to be the total taxable value of land and additions on the property. | Land | Improvement |
|---|---|---|---|---|
| 2025 | $4,816 | $487,933 | $247,000 | $240,933 |
| 2024 | $4,488 | $455,137 | $247,000 | $208,137 |
| 2023 | $4,265 | $471,186 | $241,800 | $229,386 |
| 2022 | $3,271 | $432,355 | $241,800 | $190,555 |
| 2021 | $3,193 | $294,092 | $110,400 | $183,692 |
| 2020 | $2,871 | $269,436 | $101,600 | $167,836 |
| 2019 | $2,706 | $257,179 | $101,600 | $155,579 |
| 2018 | $2,938 | $251,558 | $0 | $0 |
| 2017 | $2,682 | $227,920 | $0 | $0 |
| 2016 | $2,420 | $216,317 | $0 | $0 |
| 2015 | $2,357 | $182,045 | $0 | $0 |
| 2014 | -- | $171,049 | $0 | $0 |
| 2013 | -- | $157,247 | $0 | $0 |
Source: Public Records
Map
Nearby Homes
- 2907 NW 130th Cir
- 12510 NW 34th Ct
- 3703 NW 128th Cir
- 13103 NW 35th Ct
- 13201 NW 33rd Ave
- 12104 NW 20th Ave
- 2908 NW 130th Cir
- 3515 NW 122nd St
- 12800 NW 26th Ave
- 13406 NW 42nd Ave
- 4306 NW 121st Cir
- 11604 NW 35th Ave
- 3312 NW 116th Way
- 11419 NW 34th Ct
- 2201 NW 128th St
- 12411 NW 48th Ct
- 11801 NW 26th Ave
- 11510 NW 29th Place
- 12010 NW 48th Ct
- 12500 NW 48th Ct
- 12718 NW 35th Ave
- 12704 NW 35th Ave
- 12711 NW 36th Ave
- 12719 NW 36th Ave
- 12705 NW 36th Ave
- 3503 NW 128th St
- 12619 NW 36th Ave
- 12705 NW 35th Ave
- 12719 NW 35th Ave
- 3515 NW 128th St
- 12713 NW 35th Ave
- 3608 NW 127th St
- 0 NW 127th St Unit 1-23
- 12805 NW 35th Ave
- 3401 NW 128th St
- 12708 NW 33rd Ave
- 3502 NW 128th St
- 3502 NW 126th St
- 0 NW 36th Ave