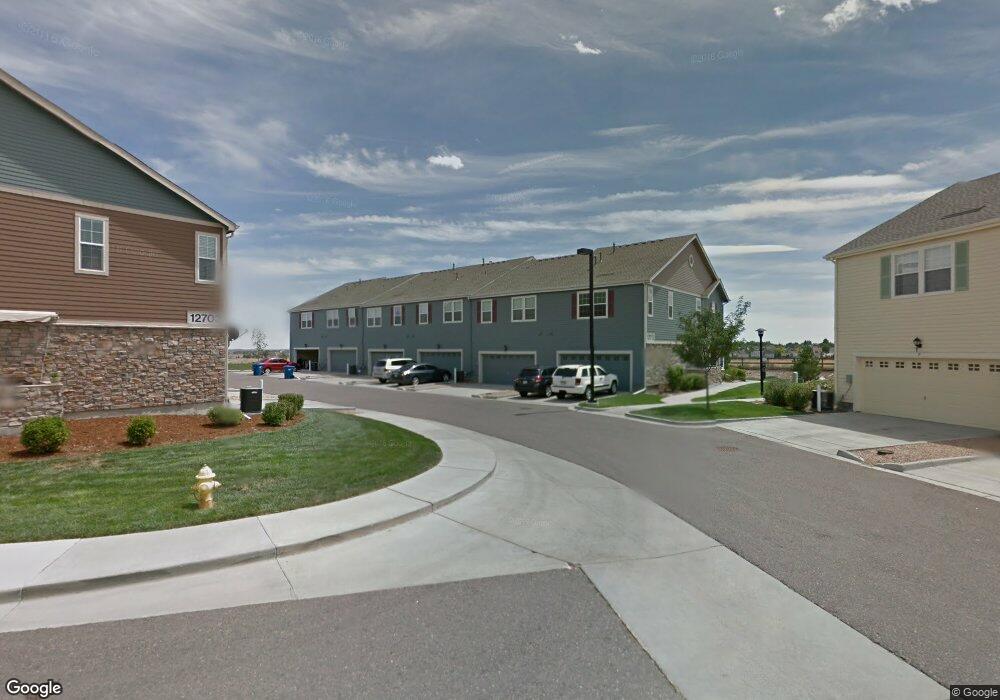
12713 Leyden St Unit I Thornton, CO 80602
Estimated Value: $366,000 - $377,000
2
Beds
2
Baths
1,472
Sq Ft
$252/Sq Ft
Est. Value
About This Home
This home is located at 12713 Leyden St Unit I, Thornton, CO 80602 and is currently estimated at $370,674, approximately $251 per square foot. 12713 Leyden St Unit I is a home located in Adams County with nearby schools including West Ridge Elementary School, Shore Acres Elementary School, and Elderberry Elementary.
Ownership History
Date
Name
Owned For
Owner Type
Purchase Details
Closed on
Oct 15, 2025
Sold by
Opendoor Property Trust
Bought by
Vajda Abigail Rae
Current Estimated Value
Home Financials for this Owner
Home Financials are based on the most recent Mortgage that was taken out on this home.
Original Mortgage
$216,000
Outstanding Balance
$216,000
Interest Rate
6.5%
Mortgage Type
New Conventional
Estimated Equity
$154,674
Purchase Details
Closed on
Apr 24, 2025
Sold by
Freeman David John
Bought by
Opendoor Property Trust
Purchase Details
Closed on
May 24, 2010
Sold by
Cardinali Barbara P
Bought by
Freeman David John
Home Financials for this Owner
Home Financials are based on the most recent Mortgage that was taken out on this home.
Original Mortgage
$165,483
Interest Rate
5%
Mortgage Type
VA
Purchase Details
Closed on
Nov 4, 2008
Sold by
Centex Homes
Bought by
Cardinali Barbara P
Home Financials for this Owner
Home Financials are based on the most recent Mortgage that was taken out on this home.
Original Mortgage
$132,810
Interest Rate
6.08%
Mortgage Type
FHA
Create a Home Valuation Report for This Property
The Home Valuation Report is an in-depth analysis detailing your home's value as well as a comparison with similar homes in the area
Home Values in the Area
Average Home Value in this Area
Purchase History
| Date | Buyer | Sale Price | Title Company |
|---|---|---|---|
| Vajda Abigail Rae | $360,000 | Os National | |
| Opendoor Property Trust | $365,500 | Os National | |
| Freeman David John | $162,000 | Land Title Guarantee Company | |
| Cardinali Barbara P | $134,895 | Commerce Title |
Source: Public Records
Mortgage History
| Date | Status | Borrower | Loan Amount |
|---|---|---|---|
| Open | Vajda Abigail Rae | $216,000 | |
| Previous Owner | Freeman David John | $165,483 | |
| Previous Owner | Cardinali Barbara P | $132,810 |
Source: Public Records
Tax History Compared to Growth
Tax History
| Year | Tax Paid | Tax Assessment Tax Assessment Total Assessment is a certain percentage of the fair market value that is determined by local assessors to be the total taxable value of land and additions on the property. | Land | Improvement |
|---|---|---|---|---|
| 2024 | $2,263 | $25,130 | $5,000 | $20,130 |
| 2023 | $1,595 | $26,930 | $4,740 | $22,190 |
| 2022 | $1,414 | $21,370 | $4,520 | $16,850 |
| 2021 | $2,019 | $21,370 | $4,520 | $16,850 |
| 2020 | $2,006 | $22,160 | $4,650 | $17,510 |
| 2019 | $2,008 | $22,160 | $4,650 | $17,510 |
| 2018 | $1,728 | $19,060 | $1,220 | $17,840 |
| 2017 | $1,725 | $19,060 | $1,220 | $17,840 |
| 2016 | $1,219 | $13,420 | $1,350 | $12,070 |
| 2015 | $1,217 | $13,420 | $1,350 | $12,070 |
| 2014 | $973 | $10,900 | $1,350 | $9,550 |
Source: Public Records
Map
Nearby Homes
- 12733 Leyden St Unit C
- 12754 Leyden St Unit E
- 12774 Leyden St Unit D
- 12778 Jasmine St Unit E
- 12926 Jasmine Ct
- 6731 E 128th Place
- 12682 Kearney St
- 12812 Jasmine St Unit C
- Pearl Plan at Creekside Village
- Hemingway Plan at Creekside Village
- 12845 Jasmine Way
- 12774 Jasmine Ct
- 6791 E 129th Ave
- 12771 Jasmine Ct
- 7037 E 126th Place
- 12792 Ivy St
- 7047 E 126th Place
- 7066 E 126th Place
- 12609 Jersey Cir W
- 12797 Ivy St
- 12713 Leyden St Unit ID
- 12713 Leyden St Unit I
- 12713 Leyden St Unit I
- 12713 Leyden St Unit I
- 12713 Leyden St Unit I
- 12713 Leyden St Unit I
- 12713 Leyden St Unit D
- 12713 Leyden St
- 12713 Leyden St Unit C
- 12713 Leyden St Unit B
- 12713 Leyden St Unit IA
- 12713 Leyden St Unit 12713D
- 12713 Leyden St Unit IF
- 12713 Leyden - If St Unit IF
- 12703 Leyden St Unit A
- 12703 Leyden St Unit B
- 12703 Leyden St Unit C
- 12703 Leyden St Unit D
- 12703 Leyden St Unit E
- 12703 Leyden St