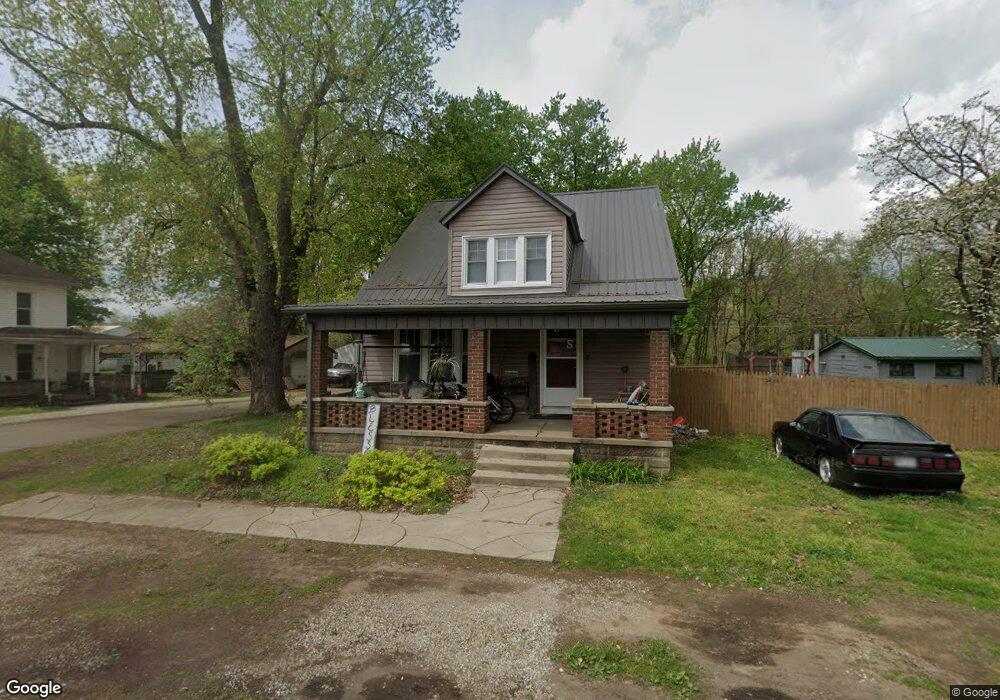
12715 3rd Ave Trinway, OH 43842
Estimated Value: $179,000 - $247,000
4
Beds
2
Baths
1,880
Sq Ft
$113/Sq Ft
Est. Value
About This Home
This home is located at 12715 3rd Ave, Trinway, OH 43842 and is currently estimated at $211,722, approximately $112 per square foot. 12715 3rd Ave is a home with nearby schools including Tri-Valley High School.
Ownership History
Date
Name
Owned For
Owner Type
Purchase Details
Closed on
Mar 26, 2014
Sold by
Morrison Gregory A
Bought by
Alexander Wendy D
Current Estimated Value
Home Financials for this Owner
Home Financials are based on the most recent Mortgage that was taken out on this home.
Original Mortgage
$60,800
Outstanding Balance
$31,230
Interest Rate
4.5%
Mortgage Type
Adjustable Rate Mortgage/ARM
Estimated Equity
$180,492
Purchase Details
Closed on
Mar 18, 2011
Sold by
Century National Bank
Bought by
Morrison Gregory A
Home Financials for this Owner
Home Financials are based on the most recent Mortgage that was taken out on this home.
Original Mortgage
$45,000
Interest Rate
5.04%
Mortgage Type
Future Advance Clause Open End Mortgage
Purchase Details
Closed on
Jul 16, 2010
Sold by
Cline Jo Ann and Cline Paul
Bought by
Century National Bank
Purchase Details
Closed on
Dec 11, 1991
Bought by
Wilden Joann
Create a Home Valuation Report for This Property
The Home Valuation Report is an in-depth analysis detailing your home's value as well as a comparison with similar homes in the area
Purchase History
| Date | Buyer | Sale Price | Title Company |
|---|---|---|---|
| Alexander Wendy D | $76,000 | None Available | |
| Morrison Gregory A | $30,000 | Attorney | |
| Morrison Gregory A | $30,000 | None Available | |
| Century National Bank | -- | Attorney | |
| Wilden Joann | $26,000 | -- |
Source: Public Records
Mortgage History
| Date | Status | Borrower | Loan Amount |
|---|---|---|---|
| Open | Alexander Wendy D | $60,800 | |
| Previous Owner | Morrison Gregory A | $45,000 |
Source: Public Records
Tax History
| Year | Tax Paid | Tax Assessment Tax Assessment Total Assessment is a certain percentage of the fair market value that is determined by local assessors to be the total taxable value of land and additions on the property. | Land | Improvement |
|---|---|---|---|---|
| 2025 | $3,135 | $50,925 | $2,940 | $47,985 |
| 2024 | $1,690 | $50,925 | $2,940 | $47,985 |
| 2023 | $1,276 | $35,455 | $2,240 | $33,215 |
| 2022 | $1,245 | $35,455 | $2,240 | $33,215 |
| 2021 | $1,185 | $34,265 | $2,240 | $32,025 |
| 2020 | $1,093 | $31,185 | $2,065 | $29,120 |
| 2019 | $1,094 | $31,185 | $2,065 | $29,120 |
| 2018 | $1,081 | $31,185 | $2,065 | $29,120 |
| 2017 | $800 | $21,945 | $2,065 | $19,880 |
| 2016 | $789 | $21,950 | $2,070 | $19,880 |
| 2015 | $804 | $21,950 | $2,070 | $19,880 |
| 2013 | $973 | $23,840 | $2,070 | $21,770 |
Source: Public Records
Map
Nearby Homes
- 12545 3rd Ave
- 416 High St
- 26 W 11th St
- 1207 Chestnut St
- 1309 Main St
- 4797 Narrows Rd
- 10200 N River Rd
- 10170 N Morrison Rd
- 3595 Maplecraft Dr
- 9385 N River Rd Unit 33
- 9220 N River Rd
- 13300 Mount Zion Rd
- 0 Eddleblute Dr
- 16200 County Road 436
- 7360 Jones Rd
- 11700 Scout Rd
- 10445 Shannon Rd
- 0 County Road 436 Unit 5182503
- 0 County Road 436 Unit 226001996
- 29 1/2 S Canal St
Your Personal Tour Guide
Ask me questions while you tour the home.