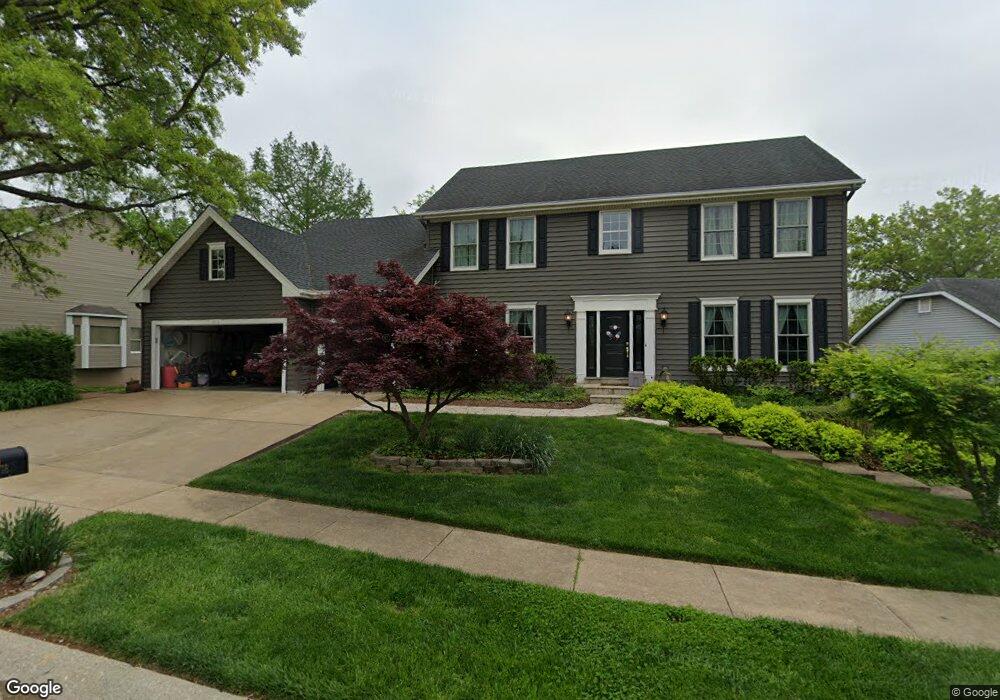
12718 Corum Way Dr Saint Louis, MO 63141
Estimated Value: $738,786 - $819,000
4
Beds
4
Baths
3,999
Sq Ft
$195/Sq Ft
Est. Value
About This Home
This home is located at 12718 Corum Way Dr, Saint Louis, MO 63141 and is currently estimated at $777,947, approximately $194 per square foot. 12718 Corum Way Dr is a home located in St. Louis County with nearby schools including Bellerive Elementary School, Parkway Northeast Middle School, and Parkway North High School.
Ownership History
Date
Name
Owned For
Owner Type
Purchase Details
Closed on
Dec 30, 2018
Sold by
Breit Sean M and Breit Sonia P
Bought by
Sean M And Sonia P Breit Revocable Trust
Current Estimated Value
Purchase Details
Closed on
May 14, 2007
Sold by
Bisram Dewanand and Bisram Lakshmi
Bought by
Breit Sean M and Breit Sonia P
Home Financials for this Owner
Home Financials are based on the most recent Mortgage that was taken out on this home.
Original Mortgage
$399,375
Outstanding Balance
$242,795
Interest Rate
6.16%
Mortgage Type
Unknown
Estimated Equity
$535,152
Purchase Details
Closed on
Nov 29, 2006
Sold by
Kidera Noboru and Kidera Taeko
Bought by
Bisram Dewanand and Bisram Lakshmi
Home Financials for this Owner
Home Financials are based on the most recent Mortgage that was taken out on this home.
Original Mortgage
$425,796
Interest Rate
6.62%
Mortgage Type
Unknown
Create a Home Valuation Report for This Property
The Home Valuation Report is an in-depth analysis detailing your home's value as well as a comparison with similar homes in the area
Home Values in the Area
Average Home Value in this Area
Purchase History
| Date | Buyer | Sale Price | Title Company |
|---|---|---|---|
| Sean M And Sonia P Breit Revocable Trust | -- | None Available | |
| Breit Sean M | $532,500 | None Available | |
| Bisram Dewanand | $390,000 | None Available |
Source: Public Records
Mortgage History
| Date | Status | Borrower | Loan Amount |
|---|---|---|---|
| Open | Breit Sean M | $399,375 | |
| Previous Owner | Bisram Dewanand | $425,796 |
Source: Public Records
Tax History Compared to Growth
Tax History
| Year | Tax Paid | Tax Assessment Tax Assessment Total Assessment is a certain percentage of the fair market value that is determined by local assessors to be the total taxable value of land and additions on the property. | Land | Improvement |
|---|---|---|---|---|
| 2025 | $7,074 | $127,410 | $29,030 | $98,380 |
| 2024 | $7,074 | $104,710 | $18,150 | $86,560 |
| 2023 | $6,791 | $104,710 | $18,150 | $86,560 |
| 2022 | $6,330 | $88,920 | $16,340 | $72,580 |
| 2021 | $6,293 | $88,920 | $16,340 | $72,580 |
| 2020 | $6,468 | $87,670 | $16,340 | $71,330 |
| 2019 | $6,330 | $87,670 | $16,340 | $71,330 |
| 2018 | $5,993 | $77,010 | $16,340 | $60,670 |
| 2017 | $5,818 | $77,010 | $16,340 | $60,670 |
| 2016 | $6,088 | $77,420 | $13,600 | $63,820 |
| 2015 | $6,380 | $77,420 | $13,600 | $63,820 |
| 2014 | $5,777 | $75,300 | $18,850 | $56,450 |
Source: Public Records
Map
Nearby Homes
- 12762 Hezel Ln
- 683 Bellerive Estates Dr
- 12848 Haverton Dr
- 12897 Nimes Dr
- 12914 Nimes Dr
- 12874 Somerton Ridge Dr
- 12932 Nimes Dr
- 12936 Bellerive Estates Dr
- 12923 Somerton Ridge Dr
- 925 Maison Ladue Dr
- 12910 Chaumont Ct
- 815 Ariege Dr
- 12930 Ferntop Ln
- 1150 Rue La Chelle Walk Unit 1150
- 13016 Ambois Dr
- 770 Montmartre Dr
- 940 Fernview Dr
- 12430 Impact Dr
- 29 Muirfield Ln
- 485 Meadow Green Place
- 907 Corum Way Ct
- 12712 Corum Way Dr
- 12724 Corum Way Dr
- 12717 Corum Way Dr
- 903 Corum Way Ct
- 12721 Corum Way Dr
- 12725 Corum Way Dr
- 12713 Corum Way Dr
- 12738 Hezel Ln
- 12707 Corum Way Dr
- 12700 Corum Way Dr
- 904 Corum Way Ct
- 12736 Corum Way Dr
- 900 Corum Way Ct
- 12701 Corum Way Dr
- 12744 Hezel Ln
- 871 N Mason Rd
- Lot 8duever Estates
- Lot 2duever Estates
- 871 N Mason Rd Unit 2530936-41222