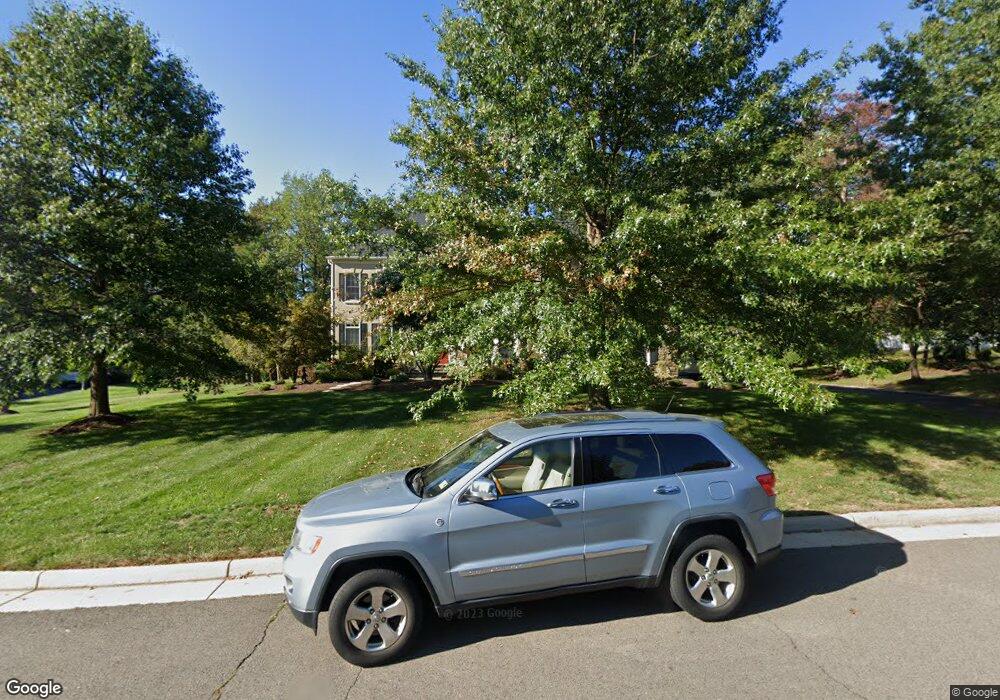
12718 Laurel Grove Way Fairfax, VA 22033
Estimated Value: $1,880,000 - $2,037,000
4
Beds
6
Baths
4,965
Sq Ft
$389/Sq Ft
Est. Value
About This Home
This home is located at 12718 Laurel Grove Way, Fairfax, VA 22033 and is currently estimated at $1,930,924, approximately $388 per square foot. 12718 Laurel Grove Way is a home located in Fairfax County with nearby schools including Navy Elementary, Franklin Middle, and Oakton High.
Ownership History
Date
Name
Owned For
Owner Type
Purchase Details
Closed on
Oct 26, 2016
Sold by
Bruce And Mary Molnia Joint Revocable Tr
Bought by
Molnia Bruce A and Molnia Mary A
Current Estimated Value
Home Financials for this Owner
Home Financials are based on the most recent Mortgage that was taken out on this home.
Original Mortgage
$417,000
Outstanding Balance
$56,300
Interest Rate
3.42%
Mortgage Type
New Conventional
Estimated Equity
$1,874,624
Purchase Details
Closed on
Jul 27, 2000
Sold by
Associ 7202 Poplar Street
Bought by
Molina Bruce F
Purchase Details
Closed on
Mar 31, 2000
Sold by
Winchester Home Sinc
Bought by
Molnia Bruce F
Home Financials for this Owner
Home Financials are based on the most recent Mortgage that was taken out on this home.
Original Mortgage
$375,000
Interest Rate
8.4%
Create a Home Valuation Report for This Property
The Home Valuation Report is an in-depth analysis detailing your home's value as well as a comparison with similar homes in the area
Home Values in the Area
Average Home Value in this Area
Purchase History
| Date | Buyer | Sale Price | Title Company |
|---|---|---|---|
| Molnia Bruce A | -- | None Available | |
| Molina Bruce F | $900,000 | -- | |
| Molnia Bruce F | $694,863 | -- |
Source: Public Records
Mortgage History
| Date | Status | Borrower | Loan Amount |
|---|---|---|---|
| Open | Molnia Bruce A | $417,000 | |
| Previous Owner | Molnia Bruce F | $375,000 |
Source: Public Records
Tax History Compared to Growth
Tax History
| Year | Tax Paid | Tax Assessment Tax Assessment Total Assessment is a certain percentage of the fair market value that is determined by local assessors to be the total taxable value of land and additions on the property. | Land | Improvement |
|---|---|---|---|---|
| 2025 | $18,438 | $1,688,110 | $519,000 | $1,169,110 |
| 2024 | $18,438 | $1,591,580 | $519,000 | $1,072,580 |
| 2023 | $17,974 | $1,592,740 | $519,000 | $1,073,740 |
| 2022 | $16,353 | $1,430,090 | $519,000 | $911,090 |
| 2021 | $14,801 | $1,261,250 | $469,000 | $792,250 |
| 2020 | $16,404 | $1,233,410 | $449,000 | $784,410 |
| 2019 | $14,597 | $1,233,410 | $449,000 | $784,410 |
| 2018 | $13,249 | $1,152,100 | $439,000 | $713,100 |
| 2017 | $13,812 | $1,189,630 | $439,000 | $750,630 |
| 2016 | $13,782 | $1,189,630 | $439,000 | $750,630 |
| 2015 | $13,276 | $1,189,630 | $439,000 | $750,630 |
| 2014 | $13,024 | $1,169,630 | $419,000 | $750,630 |
Source: Public Records
Map
Nearby Homes
- 3498 Audubon Cove
- 3494 Audubon Cove
- 12413 English Garden Ct
- 3725 Freehill Ln
- 3189 Pond Mist Way
- 3300 Lauren Oaks Ct
- 3142 Searsmont Place
- 13110 Thompson Rd
- 12748 Lady Somerset Ln
- 3884 Billberry Dr
- 12305 Westwood Hills Dr
- 13201 Jasper Rd
- 3424 Tilton Valley Dr
- 13320 Scibilia Ct
- 3321 Buckeye Ln
- 13305 Hollinger Ave
- 3351 Oakshade Ct
- 3320 Buckeye Ln
- 12909 U S 50 Unit 12909A
- 13371 Teaberry Ct
- 12716 Laurel Grove Way
- 12720 Laurel Grove Way
- 12717 Laurel Grove Way
- 12847 Parapet Way
- 12719 Laurel Grove Way
- 12849 Parapet Way
- 12715 Laurel Grove Way
- 12714 Laurel Grove Way
- 12845 Parapet Way
- 12851 Parapet Way
- 3410 Cedar Crest Ln
- 12843 Parapet Way
- 12802 Holly Grove Ct
- 12800 Holly Grove Ct
- 12853 Parapet Way
- 3408 Cedar Crest Ln
- 12709 Laurel Grove Way
- 12846 Parapet Way
- 12710 Laurel Grove Way
- 12841 Parapet Way