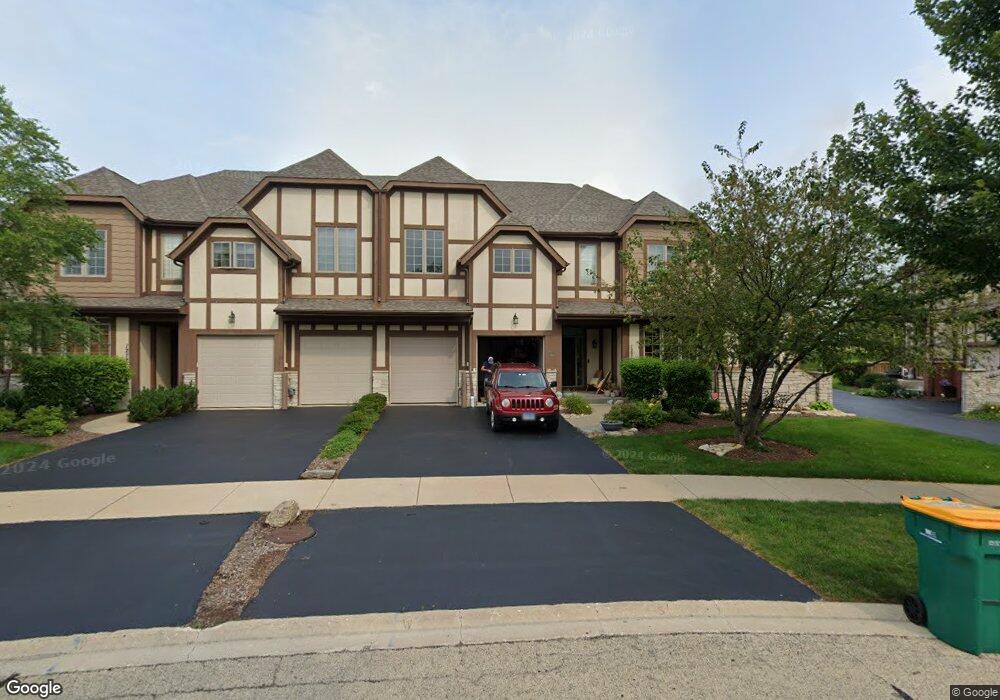
12718 Wild Rye Ct Unit C Plainfield, IL 60585
Grande Park NeighborhoodEstimated Value: $346,000 - $410,000
2
Beds
4
Baths
1,835
Sq Ft
$202/Sq Ft
Est. Value
About This Home
This home is located at 12718 Wild Rye Ct Unit C, Plainfield, IL 60585 and is currently estimated at $371,346, approximately $202 per square foot. 12718 Wild Rye Ct Unit C is a home located in Kendall County with nearby schools including Grande Park Elementary School, Murphy Junior High School, and Oswego East High School.
Ownership History
Date
Name
Owned For
Owner Type
Purchase Details
Closed on
Sep 17, 2019
Sold by
Delmedico Caterna Del and Czerniak Michael
Bought by
Dufrain Jean Jacques L
Current Estimated Value
Home Financials for this Owner
Home Financials are based on the most recent Mortgage that was taken out on this home.
Original Mortgage
$211,600
Outstanding Balance
$184,577
Interest Rate
3.4%
Mortgage Type
New Conventional
Estimated Equity
$186,769
Purchase Details
Closed on
Jun 21, 2007
Sold by
Grande Park Llc
Bought by
Delmedico Caterina
Home Financials for this Owner
Home Financials are based on the most recent Mortgage that was taken out on this home.
Original Mortgage
$285,473
Interest Rate
6.62%
Mortgage Type
Purchase Money Mortgage
Create a Home Valuation Report for This Property
The Home Valuation Report is an in-depth analysis detailing your home's value as well as a comparison with similar homes in the area
Home Values in the Area
Average Home Value in this Area
Purchase History
We collect this data history from publicly available records. To have your information removed, we recommend requesting removal directly through your county’s website.
| Date | Buyer | Sale Price | Title Company |
|---|---|---|---|
| Dufrain Jean Jacques L | $264,500 | First American Title | |
| Delmedico Caterina | $300,500 | Chicago Title Insurance Co |
Source: Public Records
Mortgage History
We collect this data history from publicly available records. To have your information removed, we recommend requesting removal directly through your county’s website.
| Date | Status | Borrower | Loan Amount |
|---|---|---|---|
| Open | Dufrain Jean Jacques L | $211,600 | |
| Previous Owner | Delmedico Caterina | $285,473 |
Source: Public Records
Tax History
| Year | Tax Paid | Tax Assessment Tax Assessment Total Assessment is a certain percentage of the fair market value that is determined by local assessors to be the total taxable value of land and additions on the property. | Land | Improvement |
|---|---|---|---|---|
| 2024 | $7,158 | $91,645 | $18,675 | $72,970 |
| 2023 | $7,146 | $89,848 | $18,309 | $71,539 |
| 2022 | $7,146 | $82,429 | $16,797 | $65,632 |
| 2021 | $6,872 | $77,036 | $15,698 | $61,338 |
| 2020 | $6,379 | $71,329 | $14,535 | $56,794 |
| 2019 | $6,654 | $67,122 | $14,535 | $52,587 |
| 2018 | $6,099 | $65,722 | $14,232 | $51,490 |
| 2017 | $6,042 | $63,195 | $13,685 | $49,510 |
| 2016 | $5,345 | $55,886 | $12,555 | $43,331 |
| 2015 | $5,242 | $52,722 | $11,844 | $40,878 |
| 2014 | -- | $49,738 | $11,174 | $38,564 |
| 2013 | -- | $52,356 | $11,762 | $40,594 |
Source: Public Records
Map
Nearby Homes
- 12704 Wild Rye Ct Unit 5B
- 12807 Timber Wood Cir
- 870 Simons Rd
- 27100 Timber Wood Ct
- 13005 Timber Wood Cir
- 12937 Grande Poplar Cir
- 13008 Timber Wood Cir
- 12922 Grande Poplar Cir
- 26613 Silverleaf Dr
- 26615 Silverleaf Dr
- 27016 Thornwood Blvd
- 13112 Wildwood Place
- 12814 Grande Poplar Cir
- 12601 S Poplar Crossing
- 26602 Grande Poplar Ct
- 12513 S Willowgate Ln
- 12929 Alpine Way
- 13002 Silverleaf Ct
- 26407 Silverleaf Dr
- 12610 S Cherry Blossom Blvd
- 12730 Wild Rye Ct
- 12730 Wild Rye Ct Unit A
- 12728 Wild Rye Ct Unit B
- 12734 Wild Rye Ct
- 12734 Wild Rye Ct Unit D
- 12724 Wild Rye Ct Unit D
- 12726 Wild Rye Ct Unit B
- 12736 Wild Rye Ct Unit C
- 12736 Wild Rye Ct
- 12738 Wild Rye Ct Unit 1B
- 12738 Wild Rye Ct Unit B
- 12740 Wild Rye Ct
- 12722 Wild Rye Ct Unit 3A
- 12722 Wild Rye Ct Unit A
- 12720 Wild Rye Ct
- 12723 Wild Rye Ct Unit 8D
- 12718 Wild Rye Ct
- 12721 Wild Rye Ct Unit C
- 12824 Timber Wood Cir
- 12824 Timber Wood Cir
Your Personal Tour Guide
Ask me questions while you tour the home.