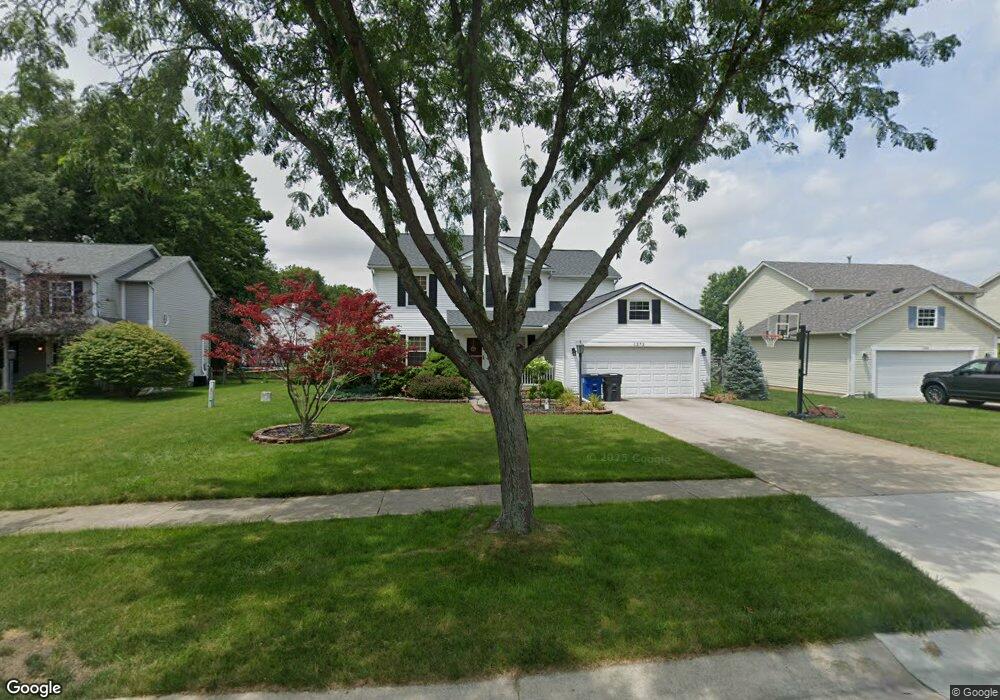
1272 Gregory Dr Perrysburg, OH 43551
Estimated Value: $382,779 - $412,000
4
Beds
3
Baths
2,474
Sq Ft
$160/Sq Ft
Est. Value
About This Home
This home is located at 1272 Gregory Dr, Perrysburg, OH 43551 and is currently estimated at $396,445, approximately $160 per square foot. 1272 Gregory Dr is a home located in Wood County with nearby schools including Toth Elementary School, Perrysburg Junior High School, and Perrysburg High School.
Ownership History
Date
Name
Owned For
Owner Type
Purchase Details
Closed on
Sep 15, 2014
Sold by
Kopitke Mark E
Bought by
Kopitke Mark E and Kopitke Jennifer L
Current Estimated Value
Home Financials for this Owner
Home Financials are based on the most recent Mortgage that was taken out on this home.
Original Mortgage
$184,000
Outstanding Balance
$140,708
Interest Rate
4.11%
Mortgage Type
New Conventional
Estimated Equity
$255,737
Purchase Details
Closed on
Aug 14, 2009
Sold by
Nitschke J Stephen and Nitschke Kelli E
Bought by
Kopitke Mark E
Home Financials for this Owner
Home Financials are based on the most recent Mortgage that was taken out on this home.
Original Mortgage
$200,305
Interest Rate
5.29%
Mortgage Type
FHA
Purchase Details
Closed on
Dec 31, 1999
Sold by
Dold Homes Inc
Bought by
Nitschke J Stephen and Nitschke Kelli E
Home Financials for this Owner
Home Financials are based on the most recent Mortgage that was taken out on this home.
Original Mortgage
$111,500
Interest Rate
7.69%
Create a Home Valuation Report for This Property
The Home Valuation Report is an in-depth analysis detailing your home's value as well as a comparison with similar homes in the area
Home Values in the Area
Average Home Value in this Area
Purchase History
| Date | Buyer | Sale Price | Title Company |
|---|---|---|---|
| Kopitke Mark E | -- | None Available | |
| Kopitke Mark E | $204,000 | Chicago Title | |
| Nitschke J Stephen | $175,700 | Louisville Title Agency For |
Source: Public Records
Mortgage History
| Date | Status | Borrower | Loan Amount |
|---|---|---|---|
| Open | Kopitke Mark E | $184,000 | |
| Closed | Kopitke Mark E | $200,305 | |
| Previous Owner | Nitschke J Stephen | $111,500 |
Source: Public Records
Tax History Compared to Growth
Tax History
| Year | Tax Paid | Tax Assessment Tax Assessment Total Assessment is a certain percentage of the fair market value that is determined by local assessors to be the total taxable value of land and additions on the property. | Land | Improvement |
|---|---|---|---|---|
| 2024 | $6,005 | $101,465 | $16,555 | $84,910 |
| 2023 | $6,005 | $101,470 | $16,560 | $84,910 |
| 2021 | $5,301 | $82,400 | $14,110 | $68,290 |
| 2020 | $5,274 | $82,400 | $14,110 | $68,290 |
| 2019 | $4,627 | $70,080 | $14,110 | $55,970 |
| 2018 | $4,122 | $70,080 | $14,110 | $55,970 |
| 2017 | $4,099 | $70,080 | $14,110 | $55,970 |
| 2016 | $3,876 | $63,360 | $14,810 | $48,550 |
| 2015 | $3,876 | $63,360 | $14,810 | $48,550 |
| 2014 | $3,909 | $63,360 | $14,810 | $48,550 |
| 2013 | $3,810 | $60,350 | $14,110 | $46,240 |
Source: Public Records
Map
Nearby Homes
- 670 Ridge Lake Ct
- 0 Brookwoode Rd
- 1380 Brookwoode Rd
- 700 Delaware Dr
- 13975 Eckel Junction Rd
- 2106 Ashley Ct
- 2107 Ashley Ct
- 11 Hawthorne Crossing
- 2837 Woods Edge Rd
- 142 Barton Creek Dr
- 144 Barton Creek Dr
- 140 Barton Creek Dr
- 158 Barton Creek Dr
- 168 Barton Creek Dr
- 162 Barton Creek Dr
- 2062 Lexington Dr
- 2053 Lexington Dr
- 1115 Hunting Creek Dr
- 26835 Mohawk Dr
- 549 Canterbury Blvd
- 1260 Gregory Dr
- 2483 Mckinley Dr
- 1248 Gregory Dr
- 1207 Tricia Ct
- 1195 Tricia Ct
- 1219 Tricia Ct
- 1183 Tricia Ct
- 2461 Mckinley Dr
- 1230 Gregory Dr
- 1269 Gregory Dr
- 1171 Tricia Ct
- 2478 Mckinley Dr
- 2490 Mckinley Dr
- 1249 Gregory Dr
- 1245 Tricia Ct
- 2443 Mckinley Dr
- 2468 Mckinley Dr
- 2440 Darcey Ct
- 2458 Mckinley Dr
- 1210 Tricia Ct