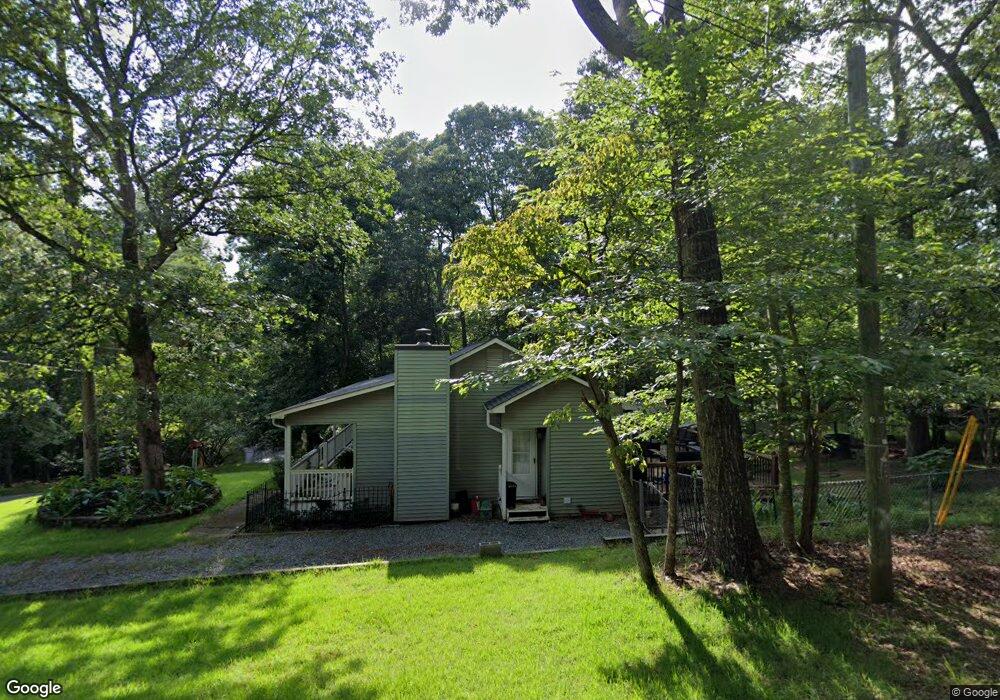
1272 Riverview Dr Ellijay, GA 30540
Estimated Value: $296,715 - $363,000
3
Beds
2
Baths
1,162
Sq Ft
$285/Sq Ft
Est. Value
About This Home
This home is located at 1272 Riverview Dr, Ellijay, GA 30540 and is currently estimated at $330,679, approximately $284 per square foot. 1272 Riverview Dr is a home located in Gilmer County with nearby schools including Ellijay Elementary School, Clear Creek Elementary School, and Clear Creek Middle School.
Ownership History
Date
Name
Owned For
Owner Type
Purchase Details
Closed on
Jun 24, 2011
Sold by
Federal National Mortgage Association
Bought by
Duke Ronald C and Duke Besty A
Current Estimated Value
Purchase Details
Closed on
Oct 5, 2010
Sold by
Citimortgage Inc
Bought by
Federal National Mortgage Association
Purchase Details
Closed on
Jun 23, 2007
Sold by
Schoen Kenneth E
Bought by
Cavender Mindy
Purchase Details
Closed on
Nov 29, 2001
Sold by
Starnes Mindy Cavend
Bought by
Schoen Kenneth E and Schoen Mindy C
Purchase Details
Closed on
Apr 1, 1993
Bought by
Starnes Mindy Cavend
Purchase Details
Closed on
Mar 1, 1992
Bought by
Starnes Mindy Cavend
Purchase Details
Closed on
Jan 1, 1982
Bought by
Starnes Mindy Cavend
Purchase Details
Closed on
Jun 1, 1981
Bought by
Starnes Mindy Cavend
Purchase Details
Closed on
May 1, 1980
Bought by
Starnes Mindy Cavend
Create a Home Valuation Report for This Property
The Home Valuation Report is an in-depth analysis detailing your home's value as well as a comparison with similar homes in the area
Home Values in the Area
Average Home Value in this Area
Purchase History
| Date | Buyer | Sale Price | Title Company |
|---|---|---|---|
| Duke Ronald C | $71,000 | -- | |
| Federal National Mortgage Association | $65,264 | -- | |
| Citimortgage Inc | $65,264 | -- | |
| Cavender Mindy | -- | -- | |
| Schoen Kenneth E | -- | -- | |
| Starnes Mindy Cavend | $66,000 | -- | |
| Starnes Mindy Cavend | $3,400 | -- | |
| Starnes Mindy Cavend | -- | -- | |
| Starnes Mindy Cavend | -- | -- | |
| Starnes Mindy Cavend | -- | -- |
Source: Public Records
Tax History Compared to Growth
Tax History
| Year | Tax Paid | Tax Assessment Tax Assessment Total Assessment is a certain percentage of the fair market value that is determined by local assessors to be the total taxable value of land and additions on the property. | Land | Improvement |
|---|---|---|---|---|
| 2024 | $203 | $116,680 | $3,400 | $113,280 |
| 2023 | $209 | $106,960 | $2,920 | $104,040 |
| 2022 | $219 | $87,440 | $2,000 | $85,440 |
| 2021 | $242 | $70,480 | $2,000 | $68,480 |
| 2020 | $271 | $54,760 | $1,920 | $52,840 |
| 2019 | $283 | $54,520 | $1,680 | $52,840 |
| 2018 | $281 | $55,000 | $1,680 | $53,320 |
| 2017 | $282 | $47,560 | $2,000 | $45,560 |
| 2016 | $282 | $48,120 | $2,000 | $46,120 |
| 2015 | $265 | $40,800 | $1,800 | $39,000 |
| 2014 | $740 | $36,200 | $1,800 | $34,400 |
| 2013 | -- | $37,200 | $1,800 | $35,400 |
Source: Public Records
Map
Nearby Homes
- 145 Rockingham Way
- Lot #385 Zenith Trail
- LT 264 Zenith Trail
- 0 Cataula Ct Unit 7652426
- 253 Zenith Trail
- 0 Double Knob Unit 10618992
- 160 Primrose Ct
- 228 Centergate Dr
- 302 Zenith Trail
- 821 Navaho Way
- LOT 478 Navaho Way
- 40 Dryad Ct
- 71 Dryad Ct
- 149 Pinecrest Ct
- 98 Forest Ct Unit 656
- 98 Forest Ct
- Lot 164, Foxhound Dr
- 0 Dawn Ln Unit 402071
- 661 Navaho Way Unit 5631
- 21 Crown Ct Unit 399
- 28 Zenith Trail
- 59 Zenith Trail Unit 256BB
- 59 Zenith Trail
- 1297 Riverview Dr Unit 5502
- 1259 Riverview Dr
- 1228 Riverview Dr
- 52 Zenith Trail Unit 273
- 52 Zenith Trail
- 0000 Citron Ct
- 0 Citron Ct Unit 3076691
- 63 Zenith Trail
- 63 Zenith Trail Unit BB257
- 1210 Riverview Dr
- 711 Riverview Dr
- LT592 Primrose Ct
- L 589 Primrose Ct
- 579 Primrose Ct
- 0 Primrose Ct Unit 10058210
- 0 Primrose Ct Unit 8156187
- 0 Primrose Ct Unit 8901320