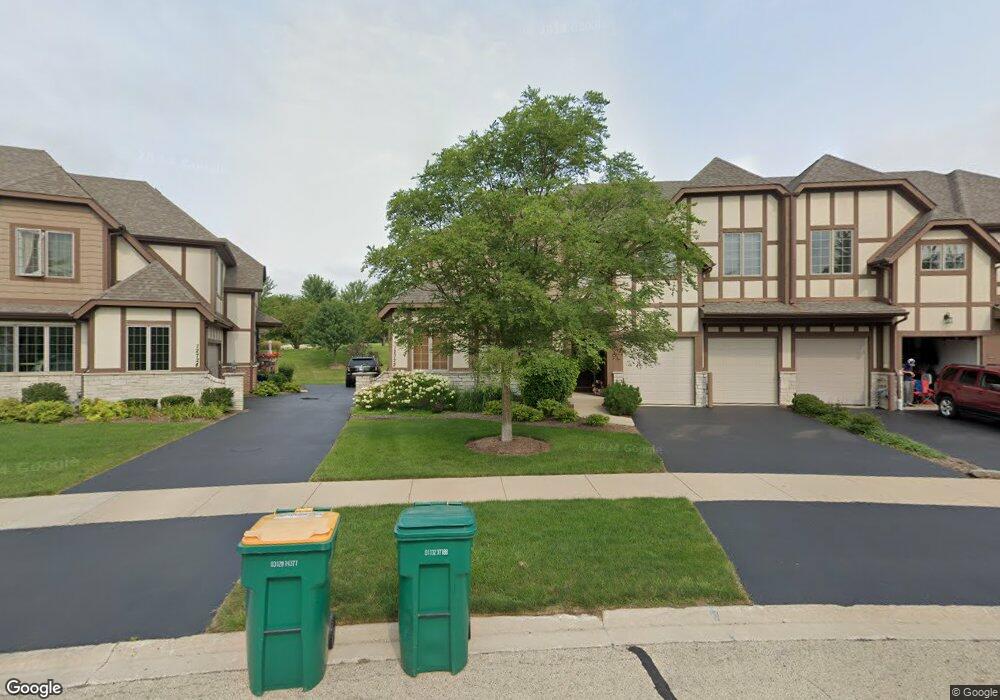
12722 Wild Rye Ct Unit 3A Plainfield, IL 60585
Grande Park NeighborhoodEstimated Value: $352,000 - $376,000
3
Beds
3
Baths
1,835
Sq Ft
$197/Sq Ft
Est. Value
About This Home
This home is located at 12722 Wild Rye Ct Unit 3A, Plainfield, IL 60585 and is currently estimated at $360,895, approximately $196 per square foot. 12722 Wild Rye Ct Unit 3A is a home located in Kendall County with nearby schools including Grande Park Elementary School, Murphy Junior High School, and Oswego East High School.
Ownership History
Date
Name
Owned For
Owner Type
Purchase Details
Closed on
Mar 12, 2021
Sold by
Hansen Debra A
Bought by
Abrams Chad P and Townsend Mindy M
Current Estimated Value
Home Financials for this Owner
Home Financials are based on the most recent Mortgage that was taken out on this home.
Original Mortgage
$251,750
Outstanding Balance
$226,321
Interest Rate
2.87%
Mortgage Type
New Conventional
Estimated Equity
$134,574
Purchase Details
Closed on
Jun 15, 2011
Sold by
Wild Rye Plainfield Llc
Bought by
Hansen Debra A
Home Financials for this Owner
Home Financials are based on the most recent Mortgage that was taken out on this home.
Original Mortgage
$190,105
Interest Rate
4.75%
Mortgage Type
FHA
Create a Home Valuation Report for This Property
The Home Valuation Report is an in-depth analysis detailing your home's value as well as a comparison with similar homes in the area
Home Values in the Area
Average Home Value in this Area
Purchase History
| Date | Buyer | Sale Price | Title Company |
|---|---|---|---|
| Abrams Chad P | $265,000 | Baird & Warner Ttl Svcs Inc | |
| Hansen Debra A | $197,000 | Chicago Title Insurance Co |
Source: Public Records
Mortgage History
| Date | Status | Borrower | Loan Amount |
|---|---|---|---|
| Open | Abrams Chad P | $251,750 | |
| Previous Owner | Hansen Debra A | $190,105 |
Source: Public Records
Tax History
| Year | Tax Paid | Tax Assessment Tax Assessment Total Assessment is a certain percentage of the fair market value that is determined by local assessors to be the total taxable value of land and additions on the property. | Land | Improvement |
|---|---|---|---|---|
| 2024 | $6,672 | $85,822 | $21,789 | $64,033 |
| 2023 | $6,656 | $84,139 | $21,362 | $62,777 |
| 2022 | $6,656 | $77,192 | $19,598 | $57,594 |
| 2021 | $6,398 | $72,142 | $18,316 | $53,826 |
| 2020 | $5,937 | $66,798 | $16,959 | $49,839 |
| 2019 | $5,661 | $63,106 | $16,959 | $46,147 |
| 2018 | $5,697 | $61,790 | $16,605 | $45,185 |
| 2017 | $5,643 | $59,413 | $15,966 | $43,447 |
| 2016 | $5,197 | $54,508 | $14,648 | $39,860 |
| 2015 | $5,096 | $51,423 | $13,819 | $37,604 |
| 2014 | $2,641 | $48,512 | $13,037 | $35,475 |
| 2013 | $2,641 | $51,065 | $13,723 | $37,342 |
Source: Public Records
Map
Nearby Homes
- 870 Simons Rd
- 27100 Timber Wood Ct
- 12811 Conifer St
- 13005 Timber Wood Cir
- 12922 Grande Poplar Cir
- 27016 Thornwood Blvd
- 12814 Grande Poplar Cir
- 12601 S Poplar Crossing
- 26537 W Countryside Ln
- 12814 Grande Pines Blvd
- 26918 Summergrove Dr
- 26315 Elizabeth Ct
- 12610 S Cherry Blossom Blvd
- 26305 W Milestone Dr
- 12910 S Hadfield Dr
- 12354 S Blue Water Pkwy
- 13036 S Slate Ln
- 26105 Grande Park Blvd
- 26101 Grande Park Blvd
- 26414 Rustling Birch Way
- 12722 Wild Rye Ct Unit A
- 12720 Wild Rye Ct
- 12718 Wild Rye Ct
- 12718 Wild Rye Ct Unit C
- 12716 Wild Rye Ct
- 12726 Wild Rye Ct Unit B
- 12724 Wild Rye Ct Unit D
- 12728 Wild Rye Ct Unit B
- 12714 Wild Rye Ct Unit A
- 12730 Wild Rye Ct
- 12730 Wild Rye Ct Unit A
- 12712 Wild Rye Ct
- 12723 Wild Rye Ct Unit 8D
- 12710 Wild Rye Ct
- 12710 Wild Rye Ct Unit C
- 12734 Wild Rye Ct
- 12734 Wild Rye Ct Unit D
- 12721 Wild Rye Ct Unit C
- 12708 Wild Rye Ct Unit D
- 12736 Wild Rye Ct Unit C
Your Personal Tour Guide
Ask me questions while you tour the home.