12725 S Laflin St Calumet Park, IL 60827
Estimated Value: $162,000 - $200,000
3
Beds
1
Bath
1,043
Sq Ft
$173/Sq Ft
Est. Value
About This Home
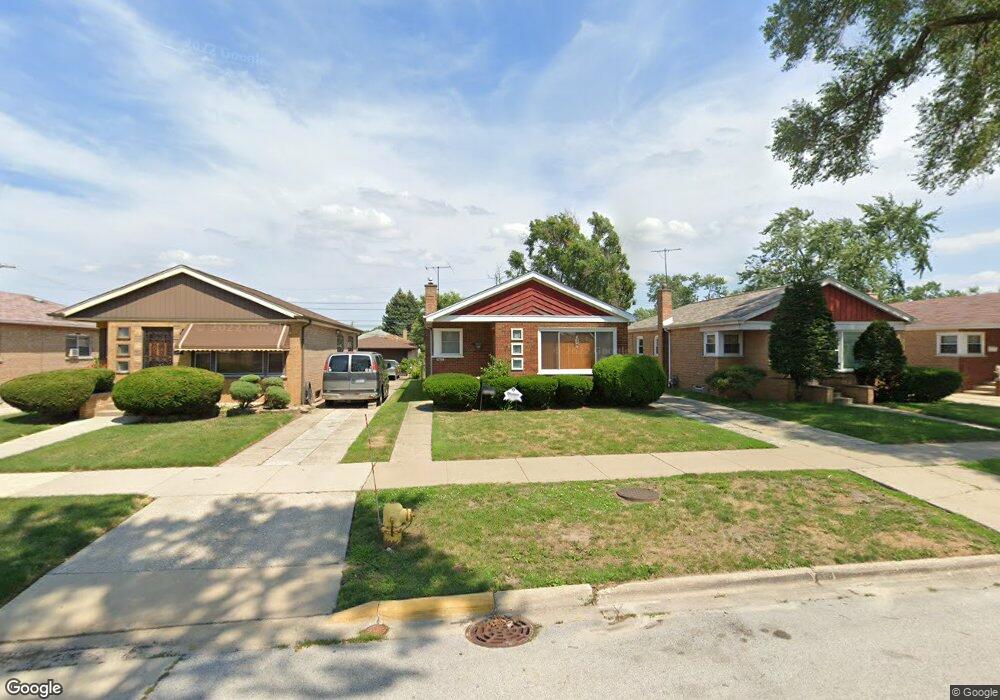
This home is located at 12725 S Laflin St, Calumet Park, IL 60827 and is currently estimated at $180,372, approximately $172 per square foot. 12725 S Laflin St is a home located in Cook County with nearby schools including Burr Oak Academy, Calumet Middle School, and A B Shepard High School.
Ownership History
Date
Name
Owned For
Owner Type
Purchase Details
Closed on
Apr 30, 2004
Sold by
Harris Aileen S
Bought by
Harris Dionte
Current Estimated Value
Home Financials for this Owner
Home Financials are based on the most recent Mortgage that was taken out on this home.
Original Mortgage
$90,000
Outstanding Balance
$46,933
Interest Rate
7.12%
Mortgage Type
Unknown
Estimated Equity
$133,439
Purchase Details
Closed on
Feb 26, 2002
Sold by
Wiggins Darryl
Bought by
Harris Aileen S
Home Financials for this Owner
Home Financials are based on the most recent Mortgage that was taken out on this home.
Original Mortgage
$81,000
Interest Rate
6.92%
Purchase Details
Closed on
May 17, 2000
Sold by
Marquette National Bank
Bought by
Wiggins Darryl
Purchase Details
Closed on
Nov 1, 1999
Sold by
Hayes Burness and Hayes Charles
Bought by
Marquette National Bank and Trust #11836
Purchase Details
Closed on
Feb 11, 1997
Sold by
Clark Porter
Bought by
Clark Porter and Hayes Burness
Create a Home Valuation Report for This Property
The Home Valuation Report is an in-depth analysis detailing your home's value as well as a comparison with similar homes in the area
Home Values in the Area
Average Home Value in this Area
Purchase History
| Date | Buyer | Sale Price | Title Company |
|---|---|---|---|
| Harris Dionte | $120,000 | Stewart Title Of Illinois | |
| Harris Aileen S | $90,000 | Exeter Title Company | |
| Wiggins Darryl | -- | Ticor Title Insurance | |
| Marquette National Bank | $60,000 | First American Title | |
| Clark Porter | -- | -- |
Source: Public Records
Mortgage History
| Date | Status | Borrower | Loan Amount |
|---|---|---|---|
| Open | Harris Dionte | $90,000 | |
| Closed | Harris Aileen S | $81,000 |
Source: Public Records
Tax History Compared to Growth
Tax History
| Year | Tax Paid | Tax Assessment Tax Assessment Total Assessment is a certain percentage of the fair market value that is determined by local assessors to be the total taxable value of land and additions on the property. | Land | Improvement |
|---|---|---|---|---|
| 2024 | $4,869 | $13,000 | $2,925 | $10,075 |
| 2023 | $3,019 | $13,000 | $2,925 | $10,075 |
| 2022 | $3,019 | $8,121 | $2,559 | $5,562 |
| 2021 | $2,967 | $8,121 | $2,559 | $5,562 |
| 2020 | $3,057 | $8,121 | $2,559 | $5,562 |
| 2019 | $4,080 | $10,571 | $2,315 | $8,256 |
| 2018 | $4,141 | $10,571 | $2,315 | $8,256 |
| 2017 | $4,026 | $10,571 | $2,315 | $8,256 |
| 2016 | $3,039 | $8,193 | $2,071 | $6,122 |
| 2015 | $4,081 | $10,601 | $2,071 | $8,530 |
| 2014 | $4,158 | $10,601 | $2,071 | $8,530 |
| 2013 | $3,701 | $10,921 | $2,071 | $8,850 |
Source: Public Records
Map
Nearby Homes
- 12732 S Laflin St
- 12806 S Laflin St
- 12700 S Laflin St
- 12636 S Loomis St
- 12536 S Bishop St
- 12629 S Throop St
- 12529 S Loomis St
- 12804 S Paulina St Unit 12804
- 12512 S Loomis St
- 12537 S Marshfield Ave
- 12816 S Racine Ave
- 12917 Page St
- 12709 S Racine Ave
- 12817 Honore St
- 1812 W 127th St
- 12437 S Throop St
- 12830 S Carpenter St
- 12850 Lincoln St
- 1904 High St
- 12946 S Carpenter St
- 12721 S Laflin St
- 12729 S Laflin St
- 12715 S Laflin St
- 12733 S Laflin St
- 12711 S Laflin St
- 12737 S Laflin St
- 12724 S Bishop St
- 12720 S Bishop St
- 12728 S Bishop St
- 12741 S Laflin St
- 12716 S Bishop St
- 12732 S Bishop St
- 12712 S Bishop St
- 12736 S Bishop St
- 12718 S Laflin St
- 12745 S Laflin St
- 12716 S Laflin St
- 12724 S Laflin St
- 12740 S Bishop St
- 12714 S Laflin St