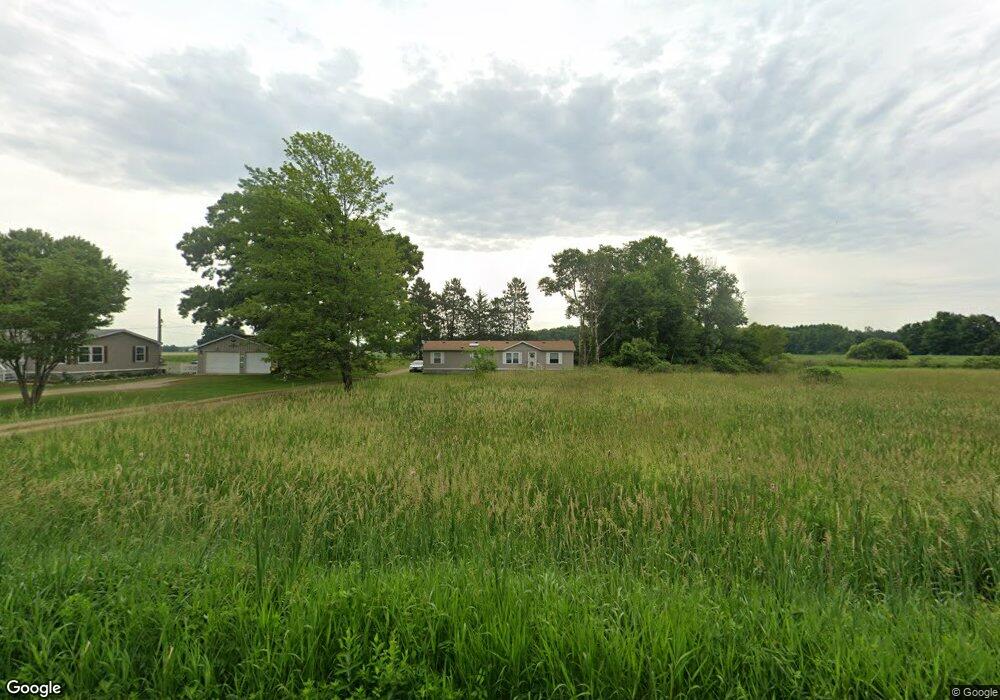
1273 26th St Allegan, MI 49010
Estimated Value: $134,000 - $216,000
--
Bed
--
Bath
1,680
Sq Ft
$111/Sq Ft
Est. Value
About This Home
This home is located at 1273 26th St, Allegan, MI 49010 and is currently estimated at $186,266, approximately $110 per square foot. 1273 26th St is a home with nearby schools including Pine Trails Elementary School, L.E. White Middle School, and Allegan High School.
Ownership History
Date
Name
Owned For
Owner Type
Purchase Details
Closed on
Dec 10, 2015
Sold by
Gibson Kandi
Bought by
Stough Anna Katharina and Gibson Kandi
Current Estimated Value
Purchase Details
Closed on
Nov 8, 2002
Sold by
Relm Investments Inc
Bought by
Gibson Kandi
Home Financials for this Owner
Home Financials are based on the most recent Mortgage that was taken out on this home.
Original Mortgage
$26,200
Interest Rate
6.08%
Purchase Details
Closed on
Mar 30, 1999
Sold by
Peckham Michael
Bought by
Walker Earl
Purchase Details
Closed on
Aug 6, 1997
Sold by
Warning Margaret
Bought by
Warning Ralph A
Create a Home Valuation Report for This Property
The Home Valuation Report is an in-depth analysis detailing your home's value as well as a comparison with similar homes in the area
Home Values in the Area
Average Home Value in this Area
Purchase History
| Date | Buyer | Sale Price | Title Company |
|---|---|---|---|
| Stough Anna Katharina | -- | None Available | |
| Gibson Kandi | $30,000 | Chicago Title | |
| Relm Investments Inc | $29,000 | Chicago Title | |
| Walker Earl | -- | -- | |
| Warning Ralph A | -- | -- |
Source: Public Records
Mortgage History
| Date | Status | Borrower | Loan Amount |
|---|---|---|---|
| Closed | Relm Investments Inc | $26,200 |
Source: Public Records
Tax History Compared to Growth
Tax History
| Year | Tax Paid | Tax Assessment Tax Assessment Total Assessment is a certain percentage of the fair market value that is determined by local assessors to be the total taxable value of land and additions on the property. | Land | Improvement |
|---|---|---|---|---|
| 2025 | $1,082 | $55,000 | $20,100 | $34,900 |
| 2024 | $986 | $51,700 | $17,600 | $34,100 |
| 2023 | $986 | $44,400 | $14,600 | $29,800 |
| 2022 | $986 | $37,600 | $12,100 | $25,500 |
| 2021 | $909 | $30,600 | $10,000 | $20,600 |
| 2020 | $909 | $27,000 | $8,400 | $18,600 |
| 2019 | $0 | $26,600 | $8,400 | $18,200 |
| 2018 | $0 | $30,900 | $8,400 | $22,500 |
| 2017 | $0 | $28,700 | $8,600 | $20,100 |
| 2016 | $0 | $13,900 | $7,900 | $6,000 |
| 2015 | -- | $13,900 | $7,900 | $6,000 |
| 2014 | -- | $13,000 | $7,600 | $5,400 |
| 2013 | -- | $13,700 | $7,600 | $6,100 |
Source: Public Records
Map
Nearby Homes