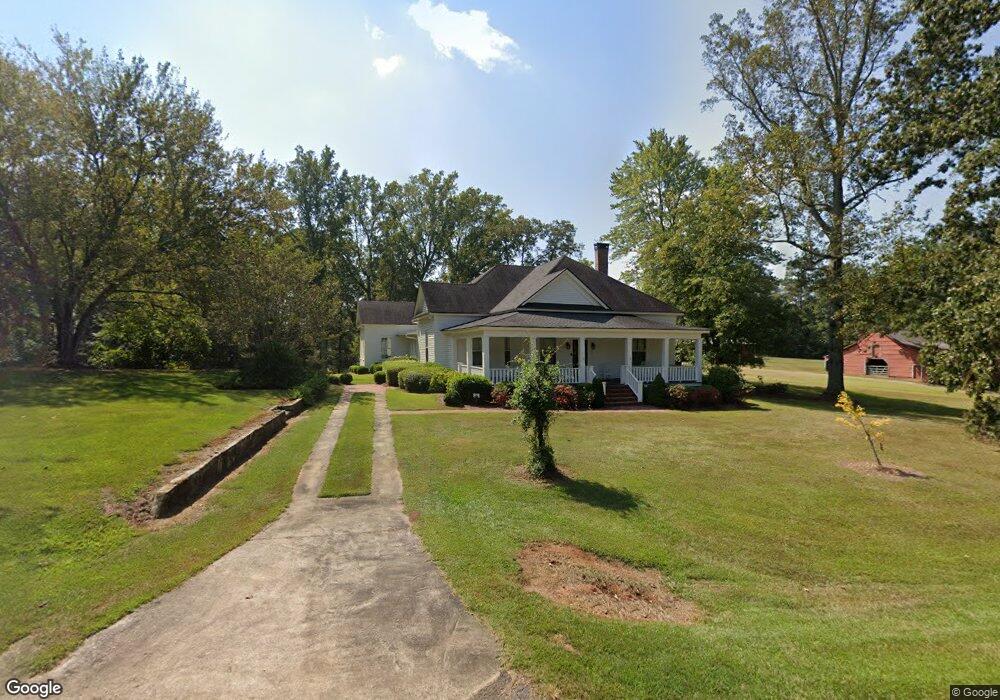
1273 Blandenburg Rd Carrollton, GA 30116
Estimated Value: $601,000 - $850,344
5
Beds
5
Baths
4,127
Sq Ft
$178/Sq Ft
Est. Value
About This Home
This home is located at 1273 Blandenburg Rd, Carrollton, GA 30116 and is currently estimated at $733,836, approximately $177 per square foot. 1273 Blandenburg Rd is a home located in Carroll County with nearby schools including Central Elementary School, Central Middle School, and Central High School.
Ownership History
Date
Name
Owned For
Owner Type
Purchase Details
Closed on
Nov 25, 2014
Sold by
Borders Verne Hanson
Bought by
Borders Verne H and Borders James R
Current Estimated Value
Purchase Details
Closed on
Nov 15, 2013
Sold by
Borders James R
Bought by
Borders Verne Hanson
Home Financials for this Owner
Home Financials are based on the most recent Mortgage that was taken out on this home.
Original Mortgage
$320,000
Interest Rate
4.31%
Mortgage Type
New Conventional
Purchase Details
Closed on
Oct 14, 2011
Sold by
Borders Joan H
Bought by
Smith Howard E
Purchase Details
Closed on
Nov 27, 1995
Sold by
Borders Verne and Borders Joan
Bought by
Borders Verne and Borders Joan
Purchase Details
Closed on
Oct 23, 1995
Sold by
Borders Verne and Borders J
Bought by
Borders Verne and Borders J
Purchase Details
Closed on
Jan 21, 1994
Sold by
Borders
Bought by
Borders Verne and Borders J
Purchase Details
Closed on
Aug 23, 1993
Bought by
Borders
Create a Home Valuation Report for This Property
The Home Valuation Report is an in-depth analysis detailing your home's value as well as a comparison with similar homes in the area
Home Values in the Area
Average Home Value in this Area
Purchase History
| Date | Buyer | Sale Price | Title Company |
|---|---|---|---|
| Borders Verne H | -- | -- | |
| Broders Verne H | $97,369 | -- | |
| Borders Verne Hanson | $200,000 | -- | |
| Smith Howard E | $6,500 | -- | |
| Borders Joan H | -- | -- | |
| Borders Verne | -- | -- | |
| Borders Verne | -- | -- | |
| Borders Verne | -- | -- | |
| Borders | -- | -- |
Source: Public Records
Mortgage History
| Date | Status | Borrower | Loan Amount |
|---|---|---|---|
| Previous Owner | Borders Verne Hanson | $320,000 |
Source: Public Records
Tax History Compared to Growth
Tax History
| Year | Tax Paid | Tax Assessment Tax Assessment Total Assessment is a certain percentage of the fair market value that is determined by local assessors to be the total taxable value of land and additions on the property. | Land | Improvement |
|---|---|---|---|---|
| 2024 | $8,290 | $366,443 | $65,763 | $300,680 |
| 2023 | $8,290 | $326,324 | $52,610 | $273,714 |
| 2022 | $6,389 | $254,749 | $35,074 | $219,675 |
| 2021 | $5,555 | $216,694 | $28,059 | $188,635 |
| 2020 | $4,937 | $192,350 | $25,508 | $166,842 |
| 2019 | $4,532 | $175,141 | $25,508 | $149,633 |
| 2018 | $2,983 | $113,602 | $18,027 | $95,575 |
| 2017 | $2,057 | $78,077 | $18,027 | $60,050 |
| 2016 | $2,057 | $78,077 | $18,027 | $60,050 |
| 2015 | $1,384 | $49,508 | $10,509 | $39,000 |
| 2014 | $1,390 | $49,509 | $10,509 | $39,000 |
Source: Public Records
Map
Nearby Homes
- 197 Westbrook Rd
- 311 Hidden Lakes Dr
- 213 Shady Valley Dr
- 106 Victoria Way
- 106 Victoria Vining
- 40 Westbrook Rd
- 1745 Stripling Chapel Rd
- 143 Oak Leaf Dr Unit 163
- 143 Oak Leaf Dr
- 39 Hampton Way
- 185 White Oak Ct
- 184 Whooping Creek Church Rd
- 0 Clem Lowell Rd Unit 10479926
- 0 Clem Lowell Rd Unit 147578
- 0 Clem Lowell Rd Unit 7630669
- 703 Central High Rd
- 587 Whooping Creek Rd
- 420 Whooping Creek Rd
- 103 Thornbrook Ct
- 1001 Whooping Creek Rd
- 192 Mount Pleasant Rd
- 1340 Blandenburg Rd
- 236 Mount Pleasant Rd
- 443 Westbrook Rd
- 315 Westbrook Rd
- 320 Mount Pleasant Rd
- 321 Westbrook Rd
- 447 Westbrook Rd
- 265 Mount Pleasant Rd
- 235 Mount Pleasant Rd
- 64 Mount Pleasant Rd
- 64 Mount Pleasant Church Rd
- 424 Westbrook Rd
- 63 Mount Pleasant Rd
- 446 Westbrook Rd
- 129 Wynbrooke Dr
- 57 Mount Pleasant Rd
- 119 Wynbrooke Dr
- 175 Westbrook Rd
- 117 Mount Pleasant Rd