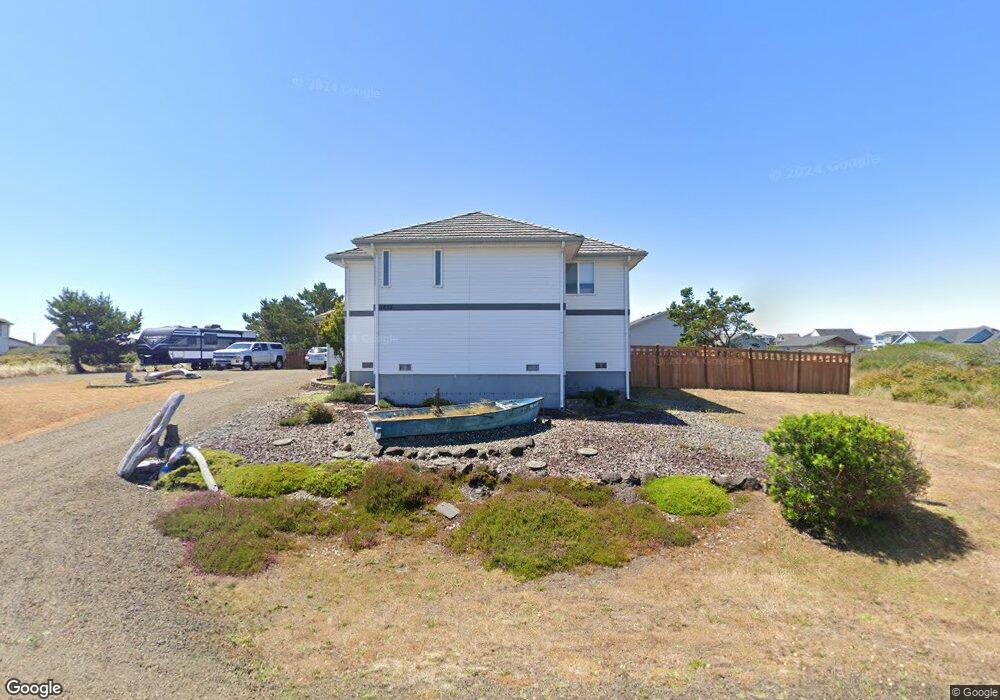
1273 Channel Ave SW Unit 98569 Ocean Shores, WA 98569
Estimated Value: $515,000 - $601,000
2
Beds
3
Baths
2,008
Sq Ft
$279/Sq Ft
Est. Value
About This Home
This home is located at 1273 Channel Ave SW Unit 98569, Ocean Shores, WA 98569 and is currently estimated at $560,163, approximately $278 per square foot. 1273 Channel Ave SW Unit 98569 is a home located in Grays Harbor County with nearby schools including North Beach Junior/Senior High School.
Ownership History
Date
Name
Owned For
Owner Type
Purchase Details
Closed on
Feb 22, 2024
Sold by
Gessert Debra K
Bought by
Henson Cynthia and Henson Wayne
Current Estimated Value
Home Financials for this Owner
Home Financials are based on the most recent Mortgage that was taken out on this home.
Original Mortgage
$299,000
Outstanding Balance
$293,160
Interest Rate
6.64%
Mortgage Type
New Conventional
Estimated Equity
$267,003
Purchase Details
Closed on
Aug 28, 2020
Sold by
Phelps Stephen
Bought by
Gessert Michael J and Gessert Debra K
Home Financials for this Owner
Home Financials are based on the most recent Mortgage that was taken out on this home.
Original Mortgage
$260,000
Interest Rate
2.9%
Mortgage Type
New Conventional
Purchase Details
Closed on
Dec 9, 2016
Sold by
Cerjance Roebrta
Bought by
Phelps Stephen
Purchase Details
Closed on
Aug 7, 2006
Sold by
Cerjance Thomas L
Bought by
Cerjance Roberta A
Create a Home Valuation Report for This Property
The Home Valuation Report is an in-depth analysis detailing your home's value as well as a comparison with similar homes in the area
Home Values in the Area
Average Home Value in this Area
Purchase History
| Date | Buyer | Sale Price | Title Company |
|---|---|---|---|
| Henson Cynthia | $499,000 | None Listed On Document | |
| Gessert Michael J | $330,000 | Pacific Title | |
| Phelps Stephen | $240,000 | Coast Title | |
| Cerjance Roberta A | -- | None Available |
Source: Public Records
Mortgage History
| Date | Status | Borrower | Loan Amount |
|---|---|---|---|
| Open | Henson Cynthia | $299,000 | |
| Previous Owner | Gessert Michael J | $260,000 |
Source: Public Records
Tax History Compared to Growth
Tax History
| Year | Tax Paid | Tax Assessment Tax Assessment Total Assessment is a certain percentage of the fair market value that is determined by local assessors to be the total taxable value of land and additions on the property. | Land | Improvement |
|---|---|---|---|---|
| 2025 | $3,733 | $589,456 | $75,000 | $514,456 |
| 2024 | $4,134 | $657,825 | $75,000 | $582,825 |
| 2023 | $3,313 | $506,704 | $100,000 | $406,704 |
| 2022 | $2,689 | $318,142 | $54,600 | $263,542 |
| 2021 | $3,210 | $318,142 | $54,600 | $263,542 |
| 2020 | $3,077 | $310,866 | $45,500 | $265,366 |
| 2019 | $3,038 | $286,742 | $45,500 | $241,242 |
| 2018 | $3,074 | $275,838 | $35,000 | $240,838 |
| 2017 | $2,951 | $263,796 | $35,000 | $228,796 |
| 2016 | $2,735 | $247,770 | $34,000 | $213,770 |
| 2014 | -- | $239,270 | $21,000 | $218,270 |
| 2013 | -- | $271,410 | $26,250 | $245,160 |
Source: Public Records
Map
Nearby Homes
- 1275 Channel Ave SW
- 1275 Cutlass Ct
- 1274 Cutlass Ct
- 415 N Portal Loop SW
- 479 Sportsmen St SW
- 1249 E Ocean Shores Blvd SW
- 1246 Camero Loop SW
- 1244 Camero Loop SW
- 1307 Ocean Shores Blvd SW Unit N24
- 432 N Spinnaker St
- 1344 N Jetty SW
- 1317 Ocean Shores Blvd SW Unit 2
- 1317 Ocean Shores Blvd SW Unit 4
- 453 N Bel Air Loop SW
- 1335 Ocean Shores Blvd SW Unit S14
- 454 N Portal Loop SW
- 455 N Portal Loop SW
- 1511 E Ocean Shores Blvd SW
- 1493 E Ocean Shores Blvd SW
- 1533 E Ocean Shores Blvd SW
- 1273 Channel Ave SW
- 1267 Channel Ave SW
- 1274 Fleetwood Ave SW
- 1280 Fleetwood Ave SW
- 1272 Fleetwood Ave SW
- 1263 Channel Ave SW
- 1279 Channel Ave SW
- 1274 Channel Ave SW
- 1266 Channel Ave SW
- 1284 Fleetwood Ave SW
- 1276 Channel Ave SW
- 1268 Fleetwood Ave SW
- 1261 Channel Ave SW
- 1281 Channel Ave SW
- 1278 Channel Ave SW
- 1286 Fleetwood Ave SW
- 1266 Fleetwood Ave SW
- 1257 Fairwood Dr SW
- 1275 Fleetwood Ave SW