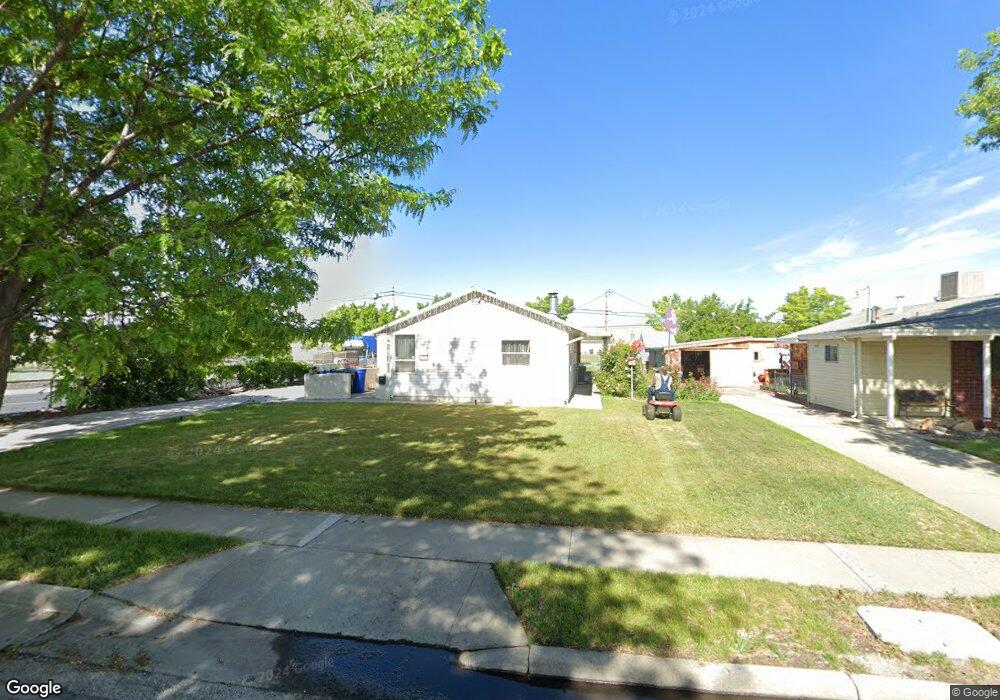
1273 Colorado St Salt Lake City, UT 84116
Rose Park NeighborhoodEstimated Value: $483,000 - $513,376
4
Beds
3
Baths
1,815
Sq Ft
$273/Sq Ft
Est. Value
About This Home
This home is located at 1273 Colorado St, Salt Lake City, UT 84116 and is currently estimated at $496,344, approximately $273 per square foot. 1273 Colorado St is a home located in Salt Lake County with nearby schools including Newman Elementary School, Northwest Middle School, and West High.
Ownership History
Date
Name
Owned For
Owner Type
Purchase Details
Closed on
Jan 26, 2023
Sold by
Johnson Family Trust
Bought by
Rush Travis and Pastuzyn Elissa
Current Estimated Value
Home Financials for this Owner
Home Financials are based on the most recent Mortgage that was taken out on this home.
Original Mortgage
$363,600
Outstanding Balance
$352,150
Interest Rate
6.31%
Mortgage Type
New Conventional
Estimated Equity
$144,194
Purchase Details
Closed on
Jan 31, 2021
Sold by
Johnson Les A and Johnson Myrna T
Bought by
Johnson Les Anthon and Johnson Myrna T
Purchase Details
Closed on
Nov 9, 2020
Sold by
Smith Jonica J
Bought by
Johnson Les A and Johnson Myma T
Purchase Details
Closed on
Aug 12, 2010
Sold by
Valdez Anthony J and Valdez Jill N
Bought by
Smith Jonica J
Home Financials for this Owner
Home Financials are based on the most recent Mortgage that was taken out on this home.
Original Mortgage
$138,139
Interest Rate
4.52%
Mortgage Type
FHA
Purchase Details
Closed on
May 15, 2007
Sold by
Valdez Anthony Jose and Valdez Jill N
Bought by
Valdez Anthony J and Valdez Jill N
Home Financials for this Owner
Home Financials are based on the most recent Mortgage that was taken out on this home.
Original Mortgage
$195,000
Interest Rate
6.17%
Mortgage Type
New Conventional
Purchase Details
Closed on
Aug 1, 1997
Sold by
Nemelka Michael J
Bought by
Valdez Anthony Jose and Valdez Jill N
Home Financials for this Owner
Home Financials are based on the most recent Mortgage that was taken out on this home.
Original Mortgage
$124,018
Interest Rate
7.57%
Mortgage Type
FHA
Purchase Details
Closed on
Aug 15, 1996
Sold by
Nemelka Michael J and Nemelka Steven R
Bought by
Nemelka Michael J
Home Financials for this Owner
Home Financials are based on the most recent Mortgage that was taken out on this home.
Original Mortgage
$49,000
Interest Rate
7.88%
Purchase Details
Closed on
Dec 31, 1995
Sold by
Nemelka Michael J
Bought by
Nemelka Michael J and Nemelka Steven R
Purchase Details
Closed on
Nov 16, 1995
Sold by
Nemelka Lawrence P
Bought by
Nemelka Michael J
Purchase Details
Closed on
Dec 15, 1993
Sold by
Nemelka Lawrence P
Bought by
Nemelka Richard S
Home Financials for this Owner
Home Financials are based on the most recent Mortgage that was taken out on this home.
Original Mortgage
$43,500
Interest Rate
7.2%
Purchase Details
Closed on
Dec 1, 1993
Sold by
Nemelka Richard S
Bought by
Nemelka Lawrence P
Home Financials for this Owner
Home Financials are based on the most recent Mortgage that was taken out on this home.
Original Mortgage
$43,500
Interest Rate
7.2%
Create a Home Valuation Report for This Property
The Home Valuation Report is an in-depth analysis detailing your home's value as well as a comparison with similar homes in the area
Home Values in the Area
Average Home Value in this Area
Purchase History
| Date | Buyer | Sale Price | Title Company |
|---|---|---|---|
| Rush Travis | -- | Us Title | |
| Johnson Les Anthon | -- | None Available | |
| Johnson Les A | -- | Meridian Title | |
| Smith Jonica J | -- | Red Rock Title Ins Agcy Llc | |
| Valdez Anthony J | -- | Crown Title | |
| Valdez Anthony Jose | -- | -- | |
| Nemelka Michael J | -- | -- | |
| Nemelka Michael J | -- | -- | |
| Nemelka Michael J | -- | -- | |
| Nemelka Richard S | -- | -- | |
| Nemelka Lawrence P | -- | -- |
Source: Public Records
Mortgage History
| Date | Status | Borrower | Loan Amount |
|---|---|---|---|
| Open | Rush Travis | $363,600 | |
| Previous Owner | Smith Jonica J | $138,139 | |
| Previous Owner | Valdez Anthony J | $195,000 | |
| Previous Owner | Valdez Anthony Jose | $124,018 | |
| Previous Owner | Nemelka Michael J | $49,000 | |
| Previous Owner | Nemelka Richard S | $43,500 | |
| Closed | Nemelka Michael J | $0 |
Source: Public Records
Tax History Compared to Growth
Tax History
| Year | Tax Paid | Tax Assessment Tax Assessment Total Assessment is a certain percentage of the fair market value that is determined by local assessors to be the total taxable value of land and additions on the property. | Land | Improvement |
|---|---|---|---|---|
| 2025 | $2,528 | $504,000 | $125,100 | $378,900 |
| 2024 | $2,528 | $482,300 | $118,400 | $363,900 |
| 2023 | $2,371 | $436,100 | $113,900 | $322,200 |
| 2022 | $2,228 | $384,400 | $111,600 | $272,800 |
| 2021 | $1,885 | $294,500 | $86,000 | $208,500 |
| 2020 | $1,809 | $269,000 | $76,800 | $192,200 |
| 2019 | $1,883 | $263,400 | $68,900 | $194,500 |
| 2018 | $1,469 | $200,200 | $65,200 | $135,000 |
| 2017 | $1,337 | $170,600 | $65,200 | $105,400 |
| 2016 | $1,268 | $153,700 | $54,800 | $98,900 |
| 2015 | $958 | $110,100 | $53,700 | $56,400 |
| 2014 | $883 | $100,600 | $52,600 | $48,000 |
Source: Public Records
Map
Nearby Homes
- 1379 Dupont Ave
- 1366 Dupont Ave
- 1183 Catherine St W
- 1320 W Sunset Dr
- 1305 N Valentine St
- 1118 N 1400 W
- 1301 N 1500 W
- 1260 W 1100 N
- 1250 Buccaneer Dr
- 1281 Carousel St
- 955 Catherine St W
- 1210 W 1000 N
- 956 N 1300 W
- 949 N Oakley St
- 945 N 1200 W
- 876 N 1300 W
- 565 N 1200 W
- 1245 W Siena Cir
- 814 N 1400 W
- 793 N 1200 W
- 1273 N Colorado St
- 1283 Colorado St
- 1263 Colorado St
- 1263 N Colorado St
- 1263 Colorado St W
- 1293 N Colorado St
- 1293 Colorado St
- 1253 Colorado St
- 1253 N Colorado St
- 1278 Colorado St
- 1278 N Colorado St
- 1303 Colorado St
- 1288 Colorado St
- 1268 N Colorado St
- 1268 Colorado St
- 1258 Colorado St
- 1243 Colorado St
- 1309 Colorado St
- 1304 Colorado St
- 1304 N Colorado St