1273 Elrod Ferry Rd Hartwell, GA 30643
Estimated Value: $386,653 - $421,000
3
Beds
2
Baths
1,568
Sq Ft
$258/Sq Ft
Est. Value
About This Home
This home is located at 1273 Elrod Ferry Rd, Hartwell, GA 30643 and is currently estimated at $405,163, approximately $258 per square foot. 1273 Elrod Ferry Rd is a home located in Hart County with nearby schools including Hart County High School and Barnes Academy.
Ownership History
Date
Name
Owned For
Owner Type
Purchase Details
Closed on
May 19, 2020
Sold by
Bratton Benjamin G
Bought by
Akers Lisa L
Current Estimated Value
Home Financials for this Owner
Home Financials are based on the most recent Mortgage that was taken out on this home.
Original Mortgage
$176,000
Outstanding Balance
$155,960
Interest Rate
3.3%
Mortgage Type
New Conventional
Estimated Equity
$249,203
Purchase Details
Closed on
Nov 20, 2019
Sold by
Melton Martin L
Bought by
Bratton Benjamin G and Bratton Teresa
Home Financials for this Owner
Home Financials are based on the most recent Mortgage that was taken out on this home.
Original Mortgage
$169,440
Interest Rate
3.75%
Purchase Details
Closed on
Sep 29, 2017
Sold by
Lecroy Melton Martin
Bought by
Lecroy Melton Martin and Melton Susan G
Purchase Details
Closed on
Nov 1, 1998
Purchase Details
Closed on
Feb 1, 1998
Purchase Details
Closed on
Feb 1, 1985
Create a Home Valuation Report for This Property
The Home Valuation Report is an in-depth analysis detailing your home's value as well as a comparison with similar homes in the area
Home Values in the Area
Average Home Value in this Area
Purchase History
| Date | Buyer | Sale Price | Title Company |
|---|---|---|---|
| Akers Lisa L | $220,507 | -- | |
| Bratton Benjamin G | $211,800 | -- | |
| Lecroy Melton Martin | -- | -- | |
| -- | $67,800 | -- | |
| -- | -- | -- | |
| -- | -- | -- | |
| -- | $8,000 | -- |
Source: Public Records
Mortgage History
| Date | Status | Borrower | Loan Amount |
|---|---|---|---|
| Open | Akers Lisa L | $176,000 | |
| Previous Owner | Bratton Benjamin G | $169,440 |
Source: Public Records
Tax History Compared to Growth
Tax History
| Year | Tax Paid | Tax Assessment Tax Assessment Total Assessment is a certain percentage of the fair market value that is determined by local assessors to be the total taxable value of land and additions on the property. | Land | Improvement |
|---|---|---|---|---|
| 2024 | $1,948 | $126,157 | $58,000 | $68,157 |
| 2023 | $1,915 | $115,011 | $58,000 | $57,011 |
| 2022 | $1,800 | $108,076 | $58,000 | $50,076 |
| 2021 | $1,610 | $86,777 | $42,000 | $44,777 |
| 2020 | $1,567 | $80,912 | $42,000 | $38,912 |
| 2019 | $1,275 | $75,247 | $41,000 | $34,247 |
| 2018 | $1,268 | $74,107 | $39,600 | $34,507 |
| 2017 | $1,268 | $73,771 | $39,600 | $34,171 |
| 2016 | $1,304 | $73,566 | $39,600 | $33,966 |
| 2015 | $1,229 | $73,286 | $39,600 | $33,686 |
| 2014 | $1,046 | $62,955 | $37,400 | $25,555 |
| 2013 | -- | $63,245 | $37,400 | $25,845 |
Source: Public Records
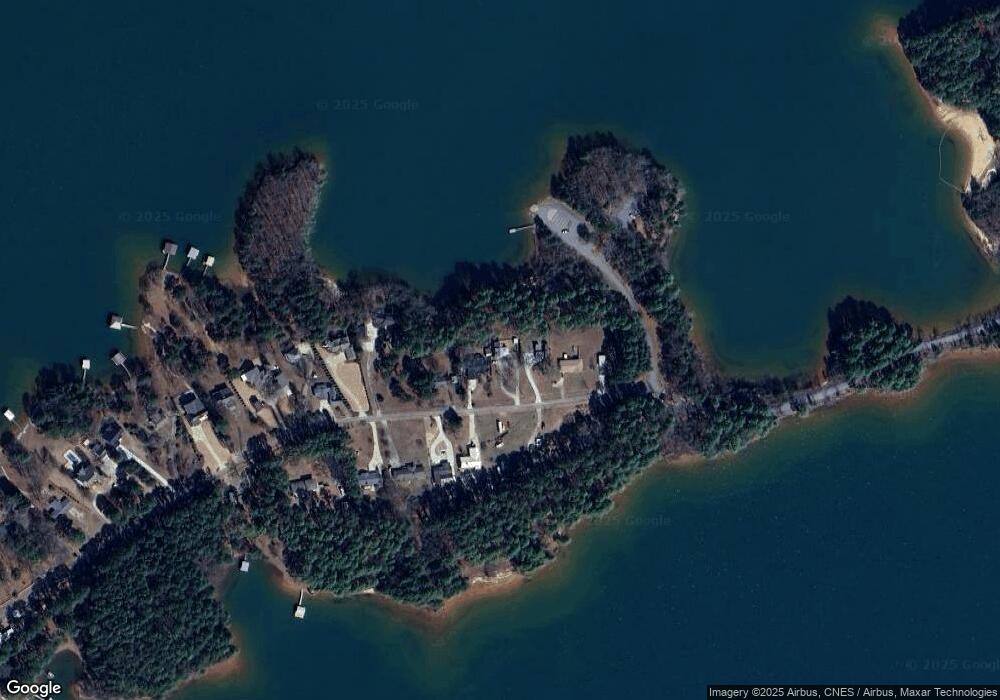
Map
Nearby Homes
- 1244 Elrod Ferry Rd
- 63 Lake Point Ln
- 94 S Pointe Dr
- 78 S Pointe Dr
- 19 S Pointe Dr
- 122 S Pointe Dr
- 151 S Pointe Dr
- 60 Villa Courts
- 35 Villa Ct
- 28 Lake Pointe Rd
- 3689 Anderson Hwy
- 3078 Anderson Hwy
- 0 Anderson Hwy Unit 10544510
- 30 Melody Farms Dr
- Lot1 Powderbag Creek Rd
- Lot3 Powderbag Creek Rd
- Lot2 Powderbag Creek Rd
- 133 Woodhurst Dr
- 119 Timberlane Dr
- 2370 Anderson Hwy
- 1243 Elrod Ferry Rd
- 1285 Elrod Ferry Rd
- LOT 16 Elrod Ferry Rd
- Lot 10 Elrod Ferry Rd
- Lot 8 Elrod Ferry Rd
- 00 Elrod Ferry Rd
- 1233 Elrod Ferry Rd
- 1301 Elrod Ferry Rd
- 1244 Elrod Ferry Rd Unit 3-A
- 1284 Elrod Ferry Rd
- 1324 Elrod Ferry Rd
- 1216 Elrod Ferry Rd
- 1185 Elrod Ferry Rd
- 1190 Elrod Ferry Rd
- 1181 Elrod Ferry Rd
- 1182 Elrod Ferry Rd
- 1167 Elrod Ferry Rd
- 1145 Elrod Ferry Rd
- 1099 Elrod Ferry Rd
- 1084 Elrod Ferry Rd