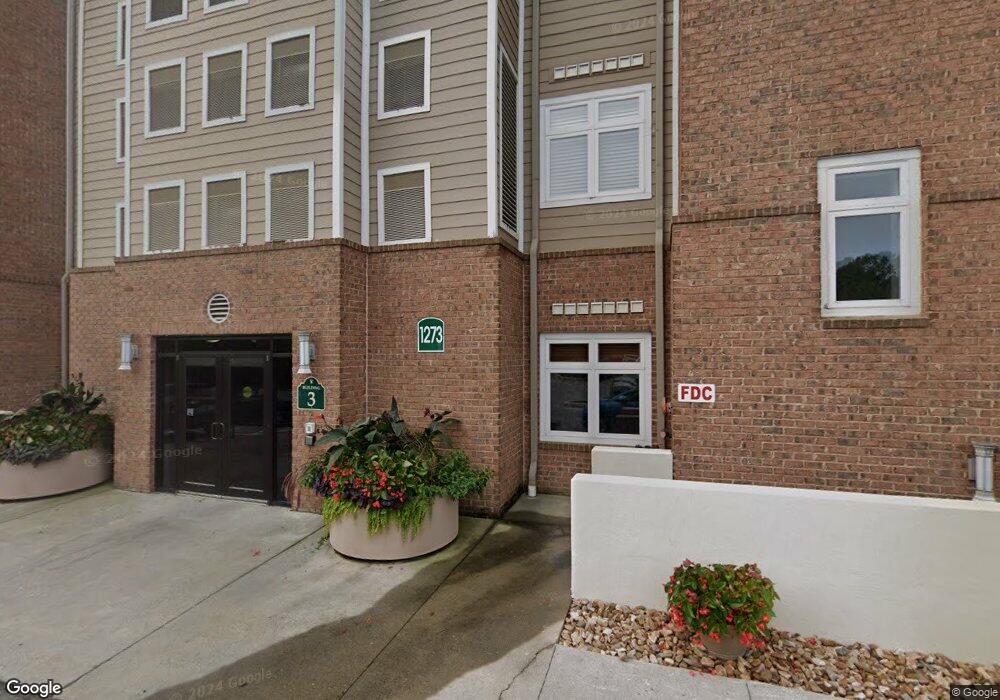
Mariners Landing 1273 Graves Harbor Trail Unit 3102 Huddleston, VA 24104
Estimated Value: $134,553 - $170,000
1
Bed
1
Bath
315
Sq Ft
$484/Sq Ft
Est. Value
About This Home
This home is located at 1273 Graves Harbor Trail Unit 3102, Huddleston, VA 24104 and is currently estimated at $152,518, approximately $484 per square foot. 1273 Graves Harbor Trail Unit 3102 is a home located in Bedford County with nearby schools including Huddleston Elementary School, Staunton River Middle School, and Staunton River High School.
Ownership History
Date
Name
Owned For
Owner Type
Purchase Details
Closed on
Jan 8, 2021
Sold by
Mariners Landing Development Company Llc
Bought by
Farrington Estates Llc
Current Estimated Value
Purchase Details
Closed on
May 1, 2020
Sold by
J W Holdings Inc
Bought by
Mariners Landing Development Llc
Purchase Details
Closed on
Jan 12, 2017
Sold by
Merritt Ralph L
Bought by
J W Holdings Inc A Virginia Corporation
Purchase Details
Closed on
Jan 3, 2017
Sold by
Hall Thomas D
Bought by
J W Holdings Inc A Virginia Corporation
Purchase Details
Closed on
Nov 28, 2016
Sold by
J W Holdings Inc A Virginia Corporation
Bought by
Burdett Jeffrey C
Purchase Details
Closed on
Aug 17, 2015
Sold by
J W Holdings Inc A Virginia Corporation
Bought by
Merrritt Ralph L
Purchase Details
Closed on
Jul 25, 2015
Sold by
J W Holdings Inc A Virginia Corporation
Bought by
Esarey Thomas Edward
Create a Home Valuation Report for This Property
The Home Valuation Report is an in-depth analysis detailing your home's value as well as a comparison with similar homes in the area
Home Values in the Area
Average Home Value in this Area
Purchase History
| Date | Buyer | Sale Price | Title Company |
|---|---|---|---|
| Farrington Estates Llc | $65,000 | Attorney | |
| Mariners Landing Development Llc | $1,919,504 | Attorney | |
| J W Holdings Inc A Virginia Corporation | -- | Attorney | |
| J W Holdings Inc A Virginia Corporation | -- | None Available | |
| Burdett Jeffrey C | -- | None Available | |
| Merrritt Ralph L | -- | None Available | |
| Esarey Thomas Edward | -- | None Available | |
| Hall Thomas D | -- | Attorney |
Source: Public Records
Tax History Compared to Growth
Tax History
| Year | Tax Paid | Tax Assessment Tax Assessment Total Assessment is a certain percentage of the fair market value that is determined by local assessors to be the total taxable value of land and additions on the property. | Land | Improvement |
|---|---|---|---|---|
| 2025 | $517 | $126,100 | $12,500 | $113,600 |
| 2024 | $517 | $126,100 | $12,500 | $113,600 |
| 2023 | $517 | $63,050 | $0 | $0 |
| 2022 | $276 | $27,600 | $0 | $0 |
| 2021 | $276 | $55,200 | $10,000 | $45,200 |
| 2020 | $276 | $55,200 | $10,000 | $45,200 |
| 2019 | $276 | $55,200 | $10,000 | $45,200 |
| 2018 | $282 | $54,200 | $10,000 | $44,200 |
| 2017 | $282 | $54,200 | $10,000 | $44,200 |
| 2016 | $282 | $54,200 | $10,000 | $44,200 |
| 2015 | $282 | $54,200 | $10,000 | $44,200 |
| 2014 | $579 | $111,400 | $25,000 | $86,400 |
Source: Public Records
About Mariners Landing
Map
Nearby Homes
- 1273 Graves Harbor Trail Unit 318
- 1273 Graves Harbor Trail Unit 324
- 1273 Graves Harbor Trail Unit 3402
- 1273 Graves Harbor Trail Unit 347
- 1273 Graves Harbor Trail Unit 338
- 1273 Graves Harbor Trail Unit 304
- 1245 Graves Harbor Trail Unit 2201
- 1245 Graves Harbor Trail Unit 217
- 1245 Graves Harbor Trail Unit 212
- 1245 Graves Harbor Trail Unit 206
- 1245 Graves Harbor Trail Unit 2103
- 1217 Graves Harbor Trail Unit 144
- 1217 Graves Harbor Trail Unit 122
- 1161/1165 Graves Harbor Trail
- 111 Retreat Ln
- 1055 Mariners Way Unit 21
- 117 Fawn Haven Ln
- 1103 Mariners Way Unit 5
- 1137 Mariners Way Unit 48
- 206 Monoacan Trail
- 1273 Graves Harbor Trail Unit 3104
- 1273 Graves Harbor Trail Unit 3100
- 1273 Graves Harbor Trail Unit 311
- 1273 Graves Harbor Trail Unit 3200/321
- 1273 Graves Harbor Trail Unit 3103
- 1273 Graves Harbor Trail Unit 3204
- 1273 Graves Harbor Trail Unit 2402
- 1273 Graves Harbor Trail Unit 2402
- 1273 Graves Harbor Trail Unit 3202
- 1273 Graves Harbor Trail Unit 3400
- 1273 Graves Harbor Trail Unit 3302
- 1273 Graves Harbor Trail Unit 331/3300/332/3301
- 1273 Graves Harbor Trail Unit 331/3300
- 1273 Graves Harbor Trail Unit 341/3400
- 1273 Graves Harbor Trail Unit 314
- 1273 Graves Harbor Trail Unit 331,332, 3300,3301
- 1273 Graves Harbor Trail Unit 323
- 1273 Graves Harbor Trail Unit 313
- 1273 Graves Harbor Trail Unit 345
- 1273 Graves Harbor Trail Unit 338/3304