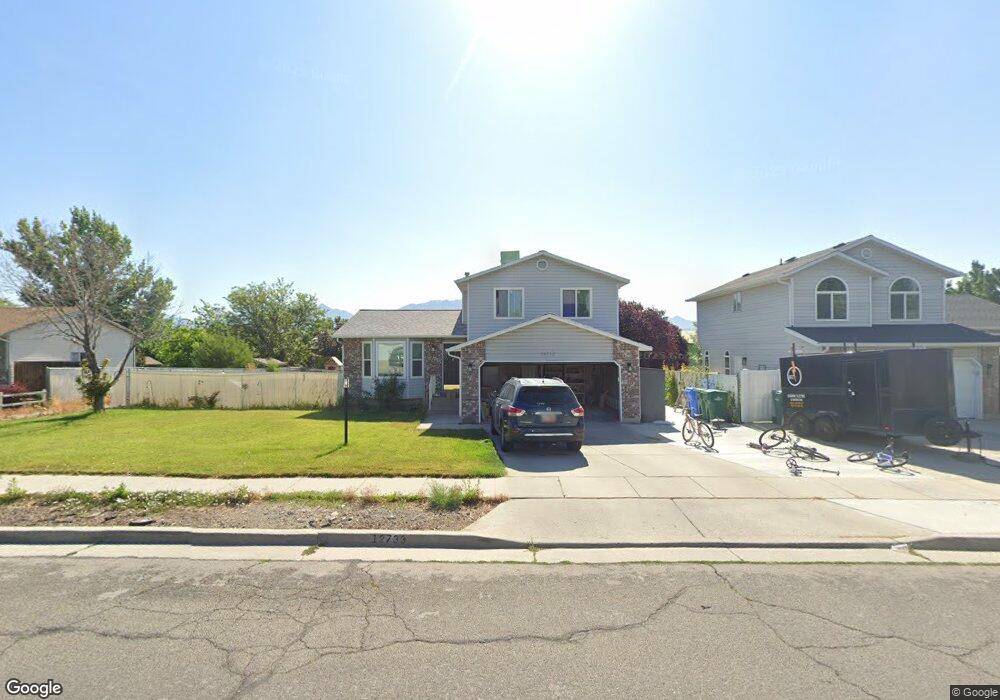
12733 Rosberg Dr Riverton, UT 84065
Estimated Value: $547,000 - $607,000
4
Beds
2
Baths
1,585
Sq Ft
$361/Sq Ft
Est. Value
About This Home
This home is located at 12733 Rosberg Dr, Riverton, UT 84065 and is currently estimated at $571,621, approximately $360 per square foot. 12733 Rosberg Dr is a home located in Salt Lake County with nearby schools including Southland Elementary School, Oquirrh Hills Middle School, and Riverton High School.
Ownership History
Date
Name
Owned For
Owner Type
Purchase Details
Closed on
Dec 11, 2015
Sold by
Gabbitas Brent S and Gabbitas Lorrie A
Bought by
Vidrine Tyson A and Vidrine Marcy G
Current Estimated Value
Home Financials for this Owner
Home Financials are based on the most recent Mortgage that was taken out on this home.
Original Mortgage
$220,924
Outstanding Balance
$171,013
Interest Rate
3.25%
Mortgage Type
FHA
Estimated Equity
$400,608
Purchase Details
Closed on
Jul 20, 1994
Sold by
Cook Steven L and Cook Rozanne M
Bought by
Gabbitas Brent S and Gabbitas Lorrie A
Home Financials for this Owner
Home Financials are based on the most recent Mortgage that was taken out on this home.
Original Mortgage
$95,400
Interest Rate
8.25%
Create a Home Valuation Report for This Property
The Home Valuation Report is an in-depth analysis detailing your home's value as well as a comparison with similar homes in the area
Home Values in the Area
Average Home Value in this Area
Purchase History
| Date | Buyer | Sale Price | Title Company |
|---|---|---|---|
| Vidrine Tyson A | -- | Title One | |
| Gabbitas Brent S | -- | -- |
Source: Public Records
Mortgage History
| Date | Status | Borrower | Loan Amount |
|---|---|---|---|
| Open | Vidrine Tyson A | $220,924 | |
| Previous Owner | Gabbitas Brent S | $95,400 |
Source: Public Records
Tax History
| Year | Tax Paid | Tax Assessment Tax Assessment Total Assessment is a certain percentage of the fair market value that is determined by local assessors to be the total taxable value of land and additions on the property. | Land | Improvement |
|---|---|---|---|---|
| 2025 | $2,542 | $454,500 | $210,500 | $244,000 |
| 2024 | $2,542 | $440,000 | $200,400 | $239,600 |
| 2023 | $2,542 | $420,100 | $196,500 | $223,600 |
| 2022 | $2,676 | $428,400 | $192,600 | $235,800 |
| 2021 | $2,278 | $324,700 | $116,600 | $208,100 |
| 2020 | $2,159 | $286,900 | $116,600 | $170,300 |
| 2019 | $2,163 | $282,500 | $110,000 | $172,500 |
| 2018 | $2,032 | $261,400 | $110,000 | $151,400 |
| 2017 | $1,953 | $244,800 | $110,000 | $134,800 |
| 2016 | $1,974 | $237,400 | $110,000 | $127,400 |
| 2015 | $1,929 | $224,900 | $112,100 | $112,800 |
| 2014 | $1,851 | $211,600 | $106,800 | $104,800 |
Source: Public Records
Map
Nearby Homes
- 12753 S Gilbert Dr
- 12495 S 3240 W
- 12906 Verona Creek Way
- 3124 W Elmwood Dr
- 13129 S 3170 W
- 3277 W 13120 S
- 12501 Falls Creek Rd
- 12872 S 3600 W
- 12332 S 2700 W
- 12243 Janice Dr
- 2328 W 12835 S
- 2356 W Montcalm Dr
- 12813 Keri Lynn Ct
- 2853 W 12075 S
- 2960 W 13400 S
- 12191 S 3600 W
- 2379 W 13100 S
- 3283 W 11975 S
- 13293 S 2480 W
- 13096 S 2110 W
- 12733 S Rosberg Dr
- 12749 S Rosberg Dr
- 12749 Rosberg Dr
- 12719 Rosberg Dr
- 12719 S Rosberg Dr
- 12740 Bergen Cir
- 12740 S Bergen Cir
- 12726 Bergen Cir
- 12726 S Bergen Cir
- 12758 S Bergen Cir
- 12758 Bergen Cir
- 12763 S Rosberg Dr
- 12763 Rosberg Dr
- 12707 S Rosberg Dr
- 12707 Rosberg Dr
- 12740 S Rosberg Dr
- 12726 Rosberg Dr
- 12740 Rosberg Dr
- 12712 Bergen Cir
- 12770 Bergen Cir
Your Personal Tour Guide
Ask me questions while you tour the home.