Estimated Value: $142,746 - $178,000
3
Beds
1
Bath
1,150
Sq Ft
$144/Sq Ft
Est. Value
About This Home
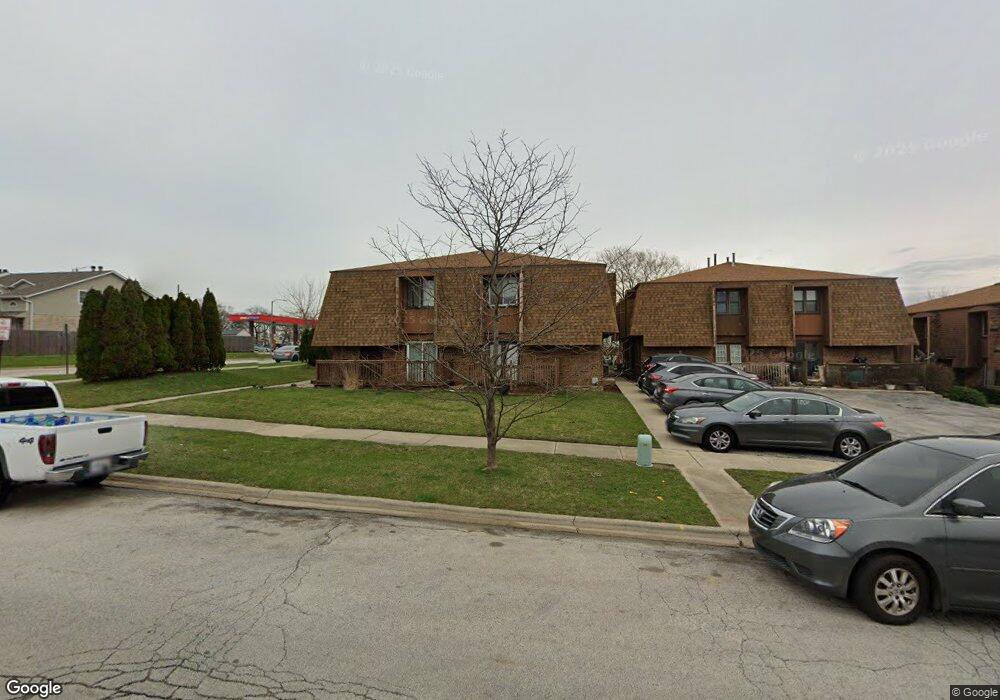
This home is located at 12739 S Kenneth Ave Unit L, Alsip, IL 60803 and is currently estimated at $165,437, approximately $143 per square foot. 12739 S Kenneth Ave Unit L is a home located in Cook County with nearby schools including George Washington Elementary School, Nathan Hale Middle School, and A B Shepard High School.
Ownership History
Date
Name
Owned For
Owner Type
Purchase Details
Closed on
Aug 14, 2006
Sold by
Orr Lori D
Bought by
Lachica Joseph S and Lachica Barbara J
Current Estimated Value
Home Financials for this Owner
Home Financials are based on the most recent Mortgage that was taken out on this home.
Original Mortgage
$122,400
Outstanding Balance
$73,567
Interest Rate
6.78%
Mortgage Type
Unknown
Estimated Equity
$91,870
Purchase Details
Closed on
May 16, 1994
Sold by
Ocallaghan Maureen
Bought by
Greene Jonathan and Greene Maryann
Home Financials for this Owner
Home Financials are based on the most recent Mortgage that was taken out on this home.
Original Mortgage
$80,478
Interest Rate
8.5%
Mortgage Type
Assumption
Create a Home Valuation Report for This Property
The Home Valuation Report is an in-depth analysis detailing your home's value as well as a comparison with similar homes in the area
Home Values in the Area
Average Home Value in this Area
Purchase History
| Date | Buyer | Sale Price | Title Company |
|---|---|---|---|
| Lachica Joseph S | $136,000 | Residential Title Services | |
| Greene Jonathan | $118,500 | -- |
Source: Public Records
Mortgage History
| Date | Status | Borrower | Loan Amount |
|---|---|---|---|
| Open | Lachica Joseph S | $122,400 | |
| Previous Owner | Greene Jonathan | $80,478 |
Source: Public Records
Tax History Compared to Growth
Tax History
| Year | Tax Paid | Tax Assessment Tax Assessment Total Assessment is a certain percentage of the fair market value that is determined by local assessors to be the total taxable value of land and additions on the property. | Land | Improvement |
|---|---|---|---|---|
| 2024 | $4,493 | $12,502 | $1,322 | $11,180 |
| 2023 | $2,517 | $12,502 | $1,322 | $11,180 |
| 2022 | $2,517 | $5,785 | $1,562 | $4,223 |
| 2021 | $2,394 | $5,784 | $1,562 | $4,222 |
| 2020 | $2,338 | $5,784 | $1,562 | $4,222 |
| 2019 | $3,761 | $9,025 | $1,442 | $7,583 |
| 2018 | $6,774 | $16,878 | $1,442 | $15,436 |
| 2017 | $6,905 | $16,878 | $1,442 | $15,436 |
| 2016 | $4,381 | $10,520 | $1,201 | $9,319 |
| 2015 | $4,295 | $10,520 | $1,201 | $9,319 |
| 2014 | $4,171 | $10,520 | $1,201 | $9,319 |
| 2013 | $3,787 | $10,427 | $1,201 | $9,226 |
Source: Public Records
Map
Nearby Homes
- 12738 S Kenneth Ave Unit E
- 12736 S Kenneth Ave Unit 1A
- 4406 W 127th Place
- 12824 S Kenneth Ave Unit F1
- 4343 W Emerald Way St
- 4326 W Emerald Way St
- 4336 W Emerald Way St
- 12507 S Tripp Ave
- 4654 W 131st St Unit 1S
- 3909 W 123rd St Unit 205A
- 4735 W 122nd St
- 3729 W Glen Dr Unit 804
- 14350 S Pulaski Rd
- 12147 S Cicero Ave
- 3823 W 123rd St Unit 302
- 3821 W 123rd St Unit 301
- 12026 S Kildare Ave Unit 16
- 12539 S Quinn Dr Unit 402
- 12211 S Harding Ave
- 4818 W 122nd St Unit 3W
- 12739 S Kenneth Ave Unit K
- 12741 S Kenneth Ave Unit B
- 12739 S Kenneth Ave Unit J
- 12741 S Kenneth Ave Unit D
- 12741 S Kenneth Ave Unit C
- 12739 S Kenneth Ave Unit I
- 12741 S Kenneth Ave Unit A
- 12739 S Kenneth Ave Unit 1
- 12747 S Kenneth Ave Unit G
- 12747 S Kenneth Ave Unit E
- 12747 S Kenneth Ave Unit H
- 12747 S Kenneth Ave Unit F
- 12749 S Kenneth Ave Unit D
- 12749 S Kenneth Ave Unit B
- 12749 S Kenneth Ave Unit C
- 12755 S Kenneth Ave Unit H
- 12755 S Kenneth Ave Unit G
- 12755 S Kenneth Ave Unit F
- 12755 S Kenneth Ave Unit 10E