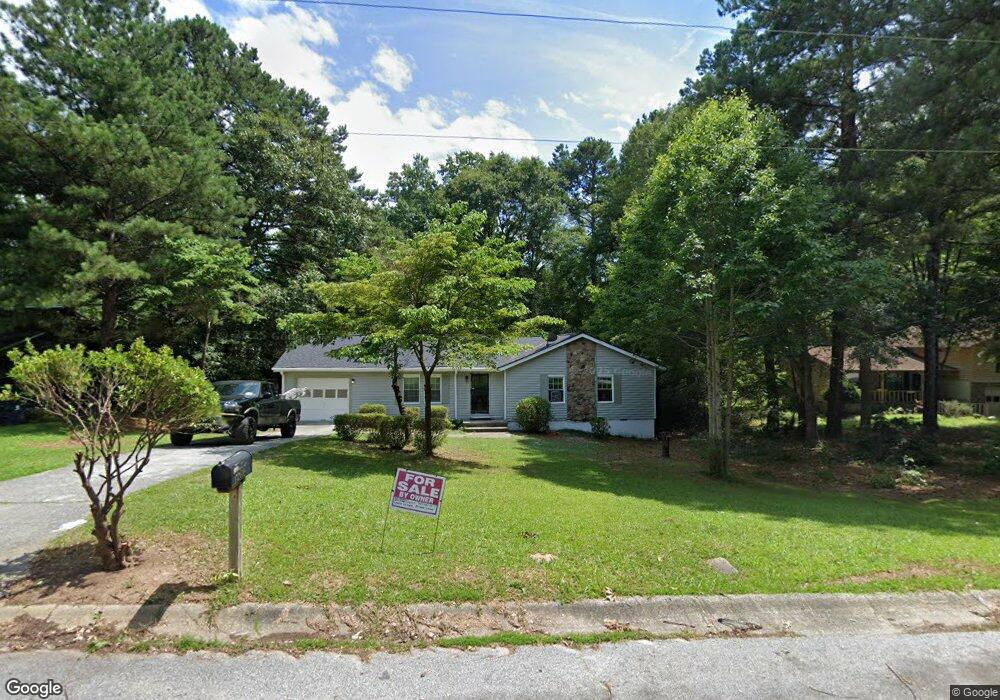
1274 Branchfield Ct Unit 5 Riverdale, GA 30296
Estimated Value: $214,627 - $271,000
3
Beds
2
Baths
1,309
Sq Ft
$184/Sq Ft
Est. Value
About This Home
This home is located at 1274 Branchfield Ct Unit 5, Riverdale, GA 30296 and is currently estimated at $241,407, approximately $184 per square foot. 1274 Branchfield Ct Unit 5 is a home located in Clayton County with nearby schools including Oliver Elementary School, Riverdale Middle School, and North Clayton High School.
Ownership History
Date
Name
Owned For
Owner Type
Purchase Details
Closed on
Apr 5, 2022
Sold by
Magee Arlene Turner
Bought by
Neisler Jason
Current Estimated Value
Purchase Details
Closed on
Apr 20, 2007
Sold by
Ira Robert N Dehaven Jr
Bought by
Hayes Arlene T
Home Financials for this Owner
Home Financials are based on the most recent Mortgage that was taken out on this home.
Original Mortgage
$110,330
Interest Rate
8.45%
Mortgage Type
New Conventional
Purchase Details
Closed on
Nov 21, 2006
Sold by
Moore Reginld
Bought by
Ira Robert H Dehaven Jr
Purchase Details
Closed on
Jan 2, 2004
Sold by
Sunrise Prop Inc
Bought by
Moore Reginald
Home Financials for this Owner
Home Financials are based on the most recent Mortgage that was taken out on this home.
Original Mortgage
$93,600
Interest Rate
7.25%
Mortgage Type
New Conventional
Create a Home Valuation Report for This Property
The Home Valuation Report is an in-depth analysis detailing your home's value as well as a comparison with similar homes in the area
Home Values in the Area
Average Home Value in this Area
Purchase History
| Date | Buyer | Sale Price | Title Company |
|---|---|---|---|
| Neisler Jason | $159,000 | -- | |
| Hayes Arlene T | -- | -- | |
| Ira Robert H Dehaven Jr | $66,100 | -- | |
| Moore Reginald | $117,000 | -- |
Source: Public Records
Mortgage History
| Date | Status | Borrower | Loan Amount |
|---|---|---|---|
| Previous Owner | Hayes Arlene T | $110,330 | |
| Previous Owner | Moore Reginald | $93,600 |
Source: Public Records
Tax History Compared to Growth
Tax History
| Year | Tax Paid | Tax Assessment Tax Assessment Total Assessment is a certain percentage of the fair market value that is determined by local assessors to be the total taxable value of land and additions on the property. | Land | Improvement |
|---|---|---|---|---|
| 2025 | $2,471 | $63,600 | $7,632 | $55,968 |
| 2024 | $2,516 | $63,600 | $7,632 | $55,968 |
| 2023 | $1,952 | $63,600 | $7,360 | $56,240 |
| 2022 | $2,159 | $54,120 | $8,000 | $46,120 |
| 2021 | $1,947 | $48,400 | $8,000 | $40,400 |
| 2020 | $1,535 | $37,514 | $8,000 | $29,514 |
| 2019 | $1,538 | $37,016 | $6,400 | $30,616 |
| 2018 | $1,442 | $34,650 | $6,400 | $28,250 |
| 2017 | $1,058 | $25,130 | $6,400 | $18,730 |
| 2016 | $836 | $19,691 | $6,400 | $13,291 |
| 2015 | $702 | $0 | $0 | $0 |
| 2014 | $760 | $18,234 | $8,400 | $9,834 |
Source: Public Records
Map
Nearby Homes
- 6897 Shangrila Way
- 6807 Shangrila Way Unit 5
- 1382 Koble Mill Ln
- 1292 Partridge Ln
- 1267 Partridge Ln
- 1061 Evans Dr
- 1516 Chase Ct
- 1090 Quail Hunt Dr
- 6712 Collier Way
- 6799 Ridgewood Ln
- 1044 Basswood Ct Unit 2
- 6678 Collier Way Unit 2
- 1357 Bethaven Rd
- 1174 Drawbridge Dr
- 1584 Hebron Ln
- 1241 Creekview Cir
- 1341 Bethaven Rd
- 1445 Diplomat Dr
- 1467 Diplomat Dr
- 1505 Diplomat Dr
- 1262 Branchfield Ct Unit 5
- 1284 Branchfield Ct
- 1287 Brookvale Dr Unit 1
- 1277 Brookvale Dr Unit 1
- 1254 Branchfield Ct
- 1254 Branchfield Ct Unit 5/56
- 1295 Brookvale Dr Unit 1
- 1273 Branchfield Ct Unit 5
- 1288 Branchfield Ct
- 1283 Branchfield Ct
- 1261 Branchfield Ct Unit 5
- 1267 Brookvale Dr Unit 1
- 1303 Brookvale Dr
- 1244 Branchfield Ct
- 1292 Branchfield Ct
- 1289 Branchfield Ct
- 1253 Branchfield Ct Unit 5
- 1259 Brookvale Dr
- 1272 Creekmoor Ct
- 1292 Brookvale Dr