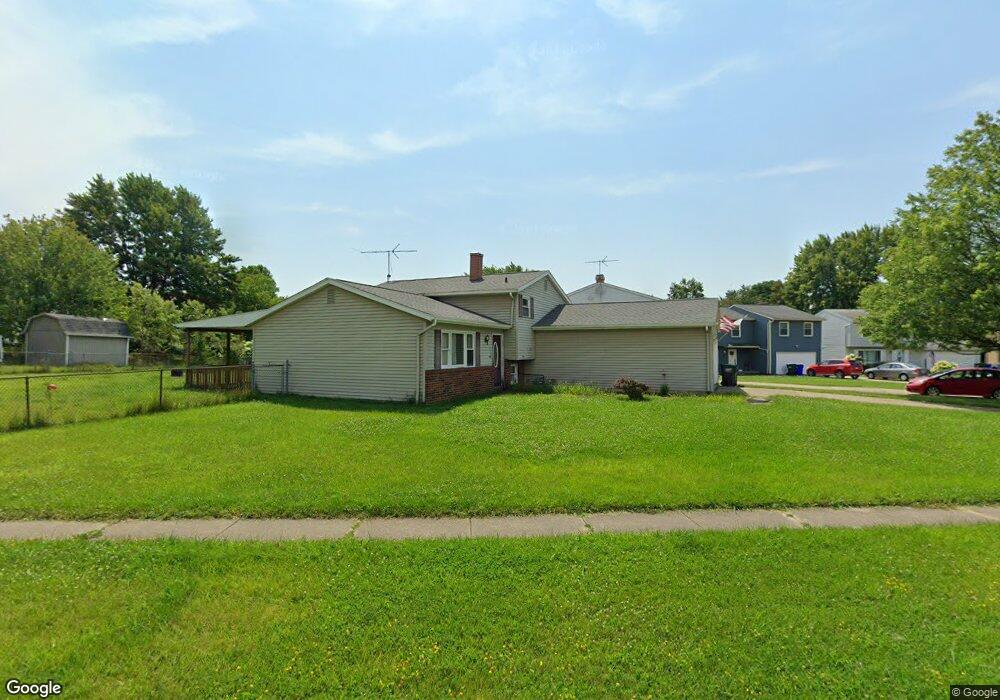
1274 Cherokee Trail Streetsboro, OH 44241
Estimated Value: $252,000 - $293,000
3
Beds
2
Baths
1,600
Sq Ft
$169/Sq Ft
Est. Value
About This Home
This home is located at 1274 Cherokee Trail, Streetsboro, OH 44241 and is currently estimated at $270,351, approximately $168 per square foot. 1274 Cherokee Trail is a home located in Portage County with nearby schools including Streetsboro High School and Crossroads Christian Academy.
Ownership History
Date
Name
Owned For
Owner Type
Purchase Details
Closed on
Sep 21, 2004
Sold by
Cole Heath M and Mccreary Michelle R
Bought by
Cole Heath M
Current Estimated Value
Home Financials for this Owner
Home Financials are based on the most recent Mortgage that was taken out on this home.
Original Mortgage
$158,110
Outstanding Balance
$78,697
Interest Rate
5.95%
Mortgage Type
Purchase Money Mortgage
Estimated Equity
$191,654
Purchase Details
Closed on
Jun 6, 2003
Sold by
Brown Lance A and Brown Gretchen K
Bought by
Anderson Richard R
Purchase Details
Closed on
Aug 5, 1996
Sold by
Zakrajsek Ralph D
Bought by
Brown Lance A and Brown Gretchen K
Home Financials for this Owner
Home Financials are based on the most recent Mortgage that was taken out on this home.
Original Mortgage
$111,600
Interest Rate
8.33%
Mortgage Type
New Conventional
Create a Home Valuation Report for This Property
The Home Valuation Report is an in-depth analysis detailing your home's value as well as a comparison with similar homes in the area
Home Values in the Area
Average Home Value in this Area
Purchase History
| Date | Buyer | Sale Price | Title Company |
|---|---|---|---|
| Cole Heath M | $70,100 | Landsel Title Agency Inc | |
| Cole Heath M | $163,000 | Landsel Title Agency Inc | |
| Anderson Richard R | $57,500 | -- | |
| Brown Lance A | $124,000 | -- |
Source: Public Records
Mortgage History
| Date | Status | Borrower | Loan Amount |
|---|---|---|---|
| Open | Cole Heath M | $158,110 | |
| Previous Owner | Brown Lance A | $111,600 |
Source: Public Records
Tax History Compared to Growth
Tax History
| Year | Tax Paid | Tax Assessment Tax Assessment Total Assessment is a certain percentage of the fair market value that is determined by local assessors to be the total taxable value of land and additions on the property. | Land | Improvement |
|---|---|---|---|---|
| 2024 | $3,002 | $72,630 | $13,020 | $59,610 |
| 2023 | $2,965 | $58,730 | $13,020 | $45,710 |
| 2022 | $2,969 | $58,730 | $13,020 | $45,710 |
| 2021 | $2,980 | $58,730 | $13,020 | $45,710 |
| 2020 | $2,899 | $52,430 | $13,020 | $39,410 |
| 2019 | $2,926 | $52,430 | $13,020 | $39,410 |
| 2018 | $2,282 | $45,400 | $13,020 | $32,380 |
| 2017 | $2,282 | $45,400 | $13,020 | $32,380 |
| 2016 | $2,254 | $45,400 | $13,020 | $32,380 |
| 2015 | $2,287 | $45,400 | $13,020 | $32,380 |
| 2014 | $2,307 | $45,400 | $13,020 | $32,380 |
| 2013 | $2,297 | $45,400 | $13,020 | $32,380 |
Source: Public Records
Map
Nearby Homes
- 1289 Apache Pass
- 1223 Cherokee Trail
- 1280 Shawnee Trail
- 1159 Shawnee Trail
- 1405 Gillie Dr
- 1516 Gillie Dr
- 1490 Evergreen Dr
- 9315 June Dr
- 9868 Meldon Dr
- 9802 S Delmonte Blvd
- 1341 Adele Dr Unit 13A
- 9495 Nita Ln
- 1013 Ashwood Ln
- 1011 Ashwood Ln
- 9989 Beverly Ln Unit 5E
- 9251 Chestnut Ct
- 9247 Chestnut Ct
- 1041 Fronek Dr
- 1725 Pike Pkwy
- 1471 Lancelot St
- 1270 Cherokee Trail
- 1322 Apache Pass
- 1320 Apache Pass
- 1273 Cherokee Trail
- 1324 Apache Pass
- 1266 Cherokee Trail
- 1326 Apache Pass
- 1318 Apache Pass
- 1262 Cherokee Trail
- 1269 Cherokee Trail
- 1328 Apache Pass
- 1256 Cherokee Trail
- 1252 Cherokee Trail
- 1265 Cherokee Trail
- 1253 Cherokee Trail
- 1330 Apache Pass
- 1261 Cherokee Trail
- 1281 Shawnee Trail
- 1257 Cherokee Trail
- 1287 Shawnee Trail