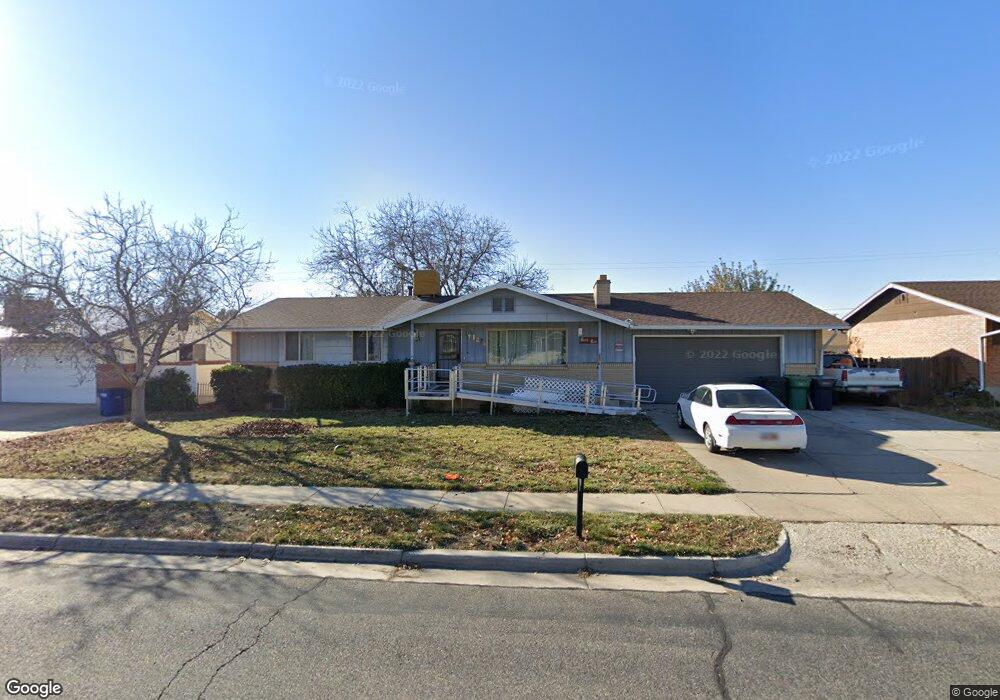
1274 S 1250 E Clearfield, UT 84015
Estimated Value: $433,000 - $473,000
5
Beds
3
Baths
2,538
Sq Ft
$178/Sq Ft
Est. Value
About This Home
This home is located at 1274 S 1250 E, Clearfield, UT 84015 and is currently estimated at $452,164, approximately $178 per square foot. 1274 S 1250 E is a home located in Davis County with nearby schools including South Clearfield Elementary School, North Davis Junior High School, and Clearfield High School.
Ownership History
Date
Name
Owned For
Owner Type
Purchase Details
Closed on
Nov 24, 1999
Sold by
Lyman Evan P and Lyman Pamela E
Bought by
Foley David A and Foley Robin L
Current Estimated Value
Home Financials for this Owner
Home Financials are based on the most recent Mortgage that was taken out on this home.
Original Mortgage
$138,855
Interest Rate
7.95%
Mortgage Type
FHA
Create a Home Valuation Report for This Property
The Home Valuation Report is an in-depth analysis detailing your home's value as well as a comparison with similar homes in the area
Home Values in the Area
Average Home Value in this Area
Purchase History
We collect this data history from publicly available records. To have your information removed, we recommend requesting removal directly through your county’s website.
| Date | Buyer | Sale Price | Title Company |
|---|---|---|---|
| Foley David A | -- | Backman Stewart Title Servic |
Source: Public Records
Mortgage History
We collect this data history from publicly available records. To have your information removed, we recommend requesting removal directly through your county’s website.
| Date | Status | Borrower | Loan Amount |
|---|---|---|---|
| Previous Owner | Foley David A | $138,855 |
Source: Public Records
Tax History
| Year | Tax Paid | Tax Assessment Tax Assessment Total Assessment is a certain percentage of the fair market value that is determined by local assessors to be the total taxable value of land and additions on the property. | Land | Improvement |
|---|---|---|---|---|
| 2025 | $2,565 | $229,900 | $79,085 | $150,815 |
| 2024 | $2,474 | $223,300 | $75,557 | $147,743 |
| 2023 | $2,239 | $371,000 | $120,211 | $250,789 |
| 2022 | $2,375 | $212,850 | $68,280 | $144,570 |
| 2021 | $2,157 | $292,000 | $76,077 | $215,923 |
| 2020 | $1,889 | $254,000 | $64,665 | $189,335 |
| 2019 | $1,831 | $243,000 | $65,273 | $177,727 |
| 2018 | $1,686 | $218,000 | $55,040 | $162,960 |
| 2016 | $1,498 | $101,255 | $23,382 | $77,873 |
| 2015 | $1,468 | $94,600 | $23,382 | $71,218 |
| 2014 | $1,390 | $90,773 | $23,382 | $67,391 |
| 2013 | -- | $88,000 | $31,659 | $56,341 |
Source: Public Records
Map
Nearby Homes
- 1415 S 1250 E
- 1345 Valhalla Dr
- 1142 E 1350 S
- 1127 E 1050 S
- 1058 S 1075 E
- 1580 E 900 S Unit H
- 846 S 1625 E Unit C
- 2054 W Mark St
- 1543 E 750 S Unit C5
- 865 S 1650 E Unit A
- 1870 N Celia Way
- 1618 W Camelot Dr
- 732 E 1000 S
- 1838 N 1690 W
- 1847 John St
- 1883 W 1575 N Unit 236
- 1888 W 1575 N Unit 235
- 949 E Chris Cir
- 1858 W 1575 N Unit 240
- 1464 W 1920 N
Your Personal Tour Guide
Ask me questions while you tour the home.