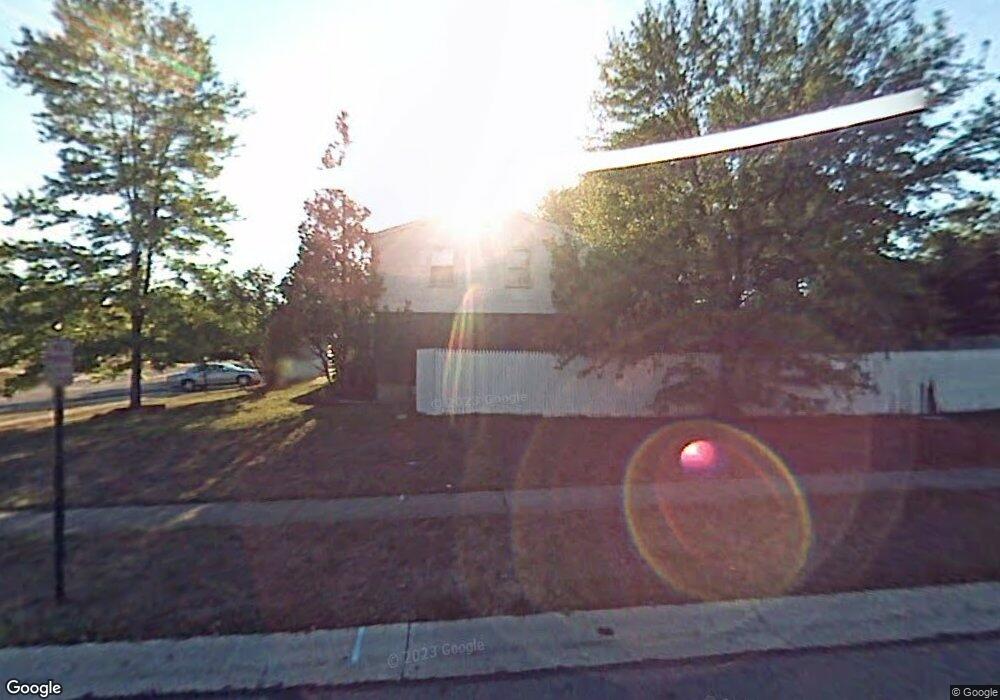
1274 Waycross Rd Cincinnati, OH 45240
Estimated Value: $229,000 - $296,000
3
Beds
3
Baths
1,548
Sq Ft
$165/Sq Ft
Est. Value
About This Home
This home is located at 1274 Waycross Rd, Cincinnati, OH 45240 and is currently estimated at $255,247, approximately $164 per square foot. 1274 Waycross Rd is a home located in Hamilton County with nearby schools including Hamilton County Mathematics and Science Academy and Calvary Academy- The.
Ownership History
Date
Name
Owned For
Owner Type
Purchase Details
Closed on
Sep 25, 2018
Sold by
Beimesche Greg and Beimesche Valerie
Bought by
Gvce Properties Llc
Current Estimated Value
Purchase Details
Closed on
Dec 22, 2010
Sold by
Tristate Holdings Llc
Bought by
Beimesche Greg and Beimesche Valerie
Purchase Details
Closed on
Dec 6, 2010
Sold by
Federal Home Loan Mortgage Corporation
Bought by
Tristate Holdings Llc
Purchase Details
Closed on
Oct 11, 2010
Sold by
Fairbanks Linda
Bought by
Federal Home Loan Mortgage Corporation
Purchase Details
Closed on
Jun 3, 1998
Sold by
Barringer Michael F and Barringer Kathleen O
Bought by
Fairbanks Linda
Create a Home Valuation Report for This Property
The Home Valuation Report is an in-depth analysis detailing your home's value as well as a comparison with similar homes in the area
Home Values in the Area
Average Home Value in this Area
Purchase History
| Date | Buyer | Sale Price | Title Company |
|---|---|---|---|
| Gvce Properties Llc | -- | None Available | |
| Beimesche Greg | $55,900 | Attorney | |
| Tristate Holdings Llc | $50,500 | Attorney | |
| Federal Home Loan Mortgage Corporation | $82,000 | None Available | |
| Fairbanks Linda | $99,300 | -- |
Source: Public Records
Tax History Compared to Growth
Tax History
| Year | Tax Paid | Tax Assessment Tax Assessment Total Assessment is a certain percentage of the fair market value that is determined by local assessors to be the total taxable value of land and additions on the property. | Land | Improvement |
|---|---|---|---|---|
| 2024 | $3,797 | $62,682 | $14,095 | $48,587 |
| 2023 | $3,775 | $62,682 | $14,095 | $48,587 |
| 2022 | $3,627 | $45,693 | $10,654 | $35,039 |
| 2021 | $3,615 | $45,693 | $10,654 | $35,039 |
| 2020 | $3,570 | $45,693 | $10,654 | $35,039 |
| 2019 | $3,269 | $36,555 | $8,523 | $28,032 |
| 2018 | $3,274 | $36,555 | $8,523 | $28,032 |
| 2017 | $3,191 | $36,555 | $8,523 | $28,032 |
| 2016 | $1,762 | $19,565 | $9,093 | $10,472 |
| 2015 | $1,619 | $19,565 | $9,093 | $10,472 |
| 2014 | $1,497 | $19,565 | $9,093 | $10,472 |
| 2013 | $1,466 | $19,565 | $9,093 | $10,472 |
Source: Public Records
Map
Nearby Homes
- 3620 Kelvin Ct
- 1251 Waycross Rd
- 11315 Lincolnshire Dr
- 1314 Waycross Rd
- 1341 Longacre Dr
- 11231 Lincolnshire Dr
- 1249 Komura Ct
- 1116 Inner Circle Dr
- 1136 Inner Circle Dr
- 11273 Leander Ct
- 1413 Waycross Rd
- 1429 Waycross Rd
- 888 W Kemper Rd
- 1451 Lemontree Dr
- 1119 Imprint Ln
- 1372 Kesta Place
- 77 Illona Dr
- 11537 Norbourne Dr
- 11233 Embassy Dr
- 11505 Oxfordshire Ln
- 1280 Waycross Rd
- 1409 Kelvin Ct
- 1268 Waycross Rd
- 1286 Waycross Rd
- 1415 Kelvin Ct
- 11306 Kenshire Dr
- 1423 Kelvin Ct
- 1292 Waycross Rd
- 1262 Waycross Rd
- 11310 Kenshire Dr
- 1429 Kelvin Ct
- 1277 Waycross Rd
- 1271 Waycross Rd
- 1283 Waycross Rd
- 11314 Kenshire Dr
- 1410 Kelvin Ct
- 1265 Waycross Rd
- 1260 Waycross Rd
- 1289 Waycross Rd
- 1444 Kelvin Ct