Estimated Value: $127,380 - $169,000
3
Beds
1
Bath
1,150
Sq Ft
$126/Sq Ft
Est. Value
About This Home
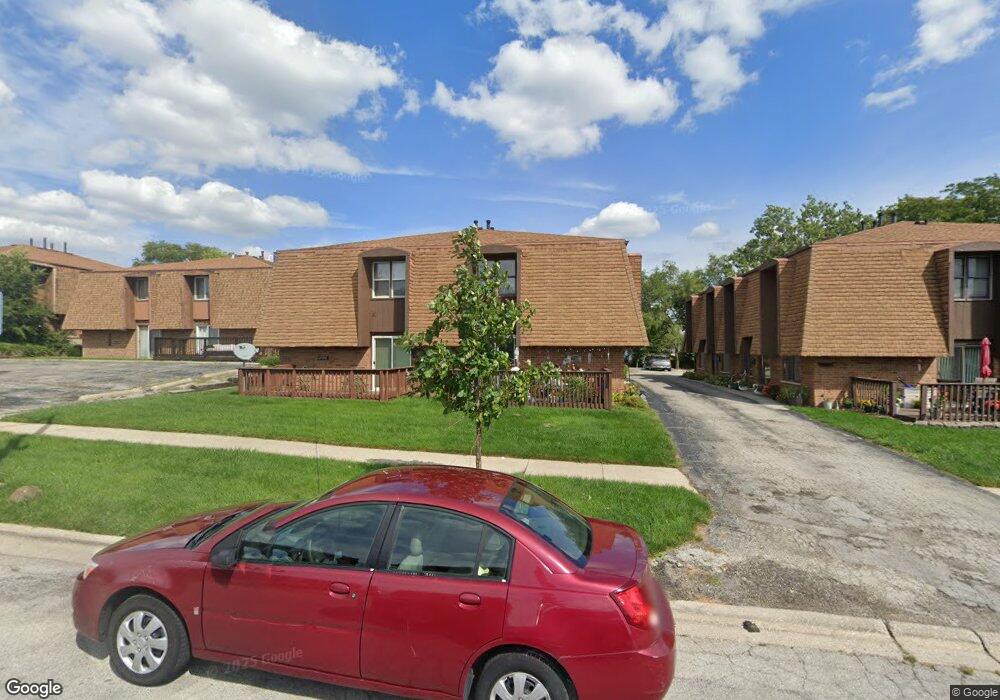
This home is located at 12749 S Kenneth Ave Unit B, Alsip, IL 60803 and is currently estimated at $144,845, approximately $125 per square foot. 12749 S Kenneth Ave Unit B is a home located in Cook County with nearby schools including George Washington Elementary School, Nathan Hale Middle School, and A B Shepard High School.
Ownership History
Date
Name
Owned For
Owner Type
Purchase Details
Closed on
Oct 28, 2005
Sold by
Coleman Donna
Bought by
Cruz Alfonso
Current Estimated Value
Home Financials for this Owner
Home Financials are based on the most recent Mortgage that was taken out on this home.
Original Mortgage
$113,800
Interest Rate
6.13%
Mortgage Type
Balloon
Purchase Details
Closed on
Oct 16, 1998
Sold by
Woodin Jeffery P and Woodin Sherri A
Bought by
Coleman Donna
Home Financials for this Owner
Home Financials are based on the most recent Mortgage that was taken out on this home.
Original Mortgage
$80,500
Interest Rate
6.88%
Purchase Details
Closed on
Aug 20, 1993
Sold by
Kalivoda Corina and Kalivoda John
Bought by
Woodin Jeffery P and Woodin Sherri A
Home Financials for this Owner
Home Financials are based on the most recent Mortgage that was taken out on this home.
Original Mortgage
$75,050
Interest Rate
7.15%
Create a Home Valuation Report for This Property
The Home Valuation Report is an in-depth analysis detailing your home's value as well as a comparison with similar homes in the area
Home Values in the Area
Average Home Value in this Area
Purchase History
| Date | Buyer | Sale Price | Title Company |
|---|---|---|---|
| Cruz Alfonso | $126,500 | Atg Search | |
| Coleman Donna | $83,000 | -- | |
| Woodin Jeffery P | $52,666 | -- |
Source: Public Records
Mortgage History
| Date | Status | Borrower | Loan Amount |
|---|---|---|---|
| Closed | Cruz Alfonso | $113,800 | |
| Previous Owner | Coleman Donna | $80,500 | |
| Previous Owner | Woodin Jeffery P | $75,050 |
Source: Public Records
Tax History Compared to Growth
Tax History
| Year | Tax Paid | Tax Assessment Tax Assessment Total Assessment is a certain percentage of the fair market value that is determined by local assessors to be the total taxable value of land and additions on the property. | Land | Improvement |
|---|---|---|---|---|
| 2024 | $2,190 | $9,410 | $1,308 | $8,102 |
| 2023 | $2,119 | $9,410 | $1,308 | $8,102 |
| 2022 | $2,119 | $8,293 | $1,546 | $6,747 |
| 2021 | $2,053 | $8,291 | $1,545 | $6,746 |
| 2020 | $2,098 | $8,291 | $1,545 | $6,746 |
| 2019 | $2,159 | $8,610 | $1,426 | $7,184 |
| 2018 | $4,305 | $14,162 | $1,426 | $12,736 |
| 2017 | $4,413 | $14,162 | $1,426 | $12,736 |
| 2016 | $2,340 | $8,117 | $1,189 | $6,928 |
| 2015 | $2,243 | $8,117 | $1,189 | $6,928 |
| 2014 | $2,200 | $8,117 | $1,189 | $6,928 |
| 2013 | $2,886 | $10,576 | $1,189 | $9,387 |
Source: Public Records
Map
Nearby Homes
- 12738 S Kenneth Ave Unit E
- 12736 S Kenneth Ave Unit 1A
- 12824 S Kenneth Ave Unit F1
- 4406 W 127th Place
- 4343 W Emerald Way St
- 4326 W Emerald Way St
- 4336 W Emerald Way St
- 12507 S Tripp Ave
- 4654 W 131st St Unit 1S
- 14350 S Pulaski Rd
- 3909 W 123rd St Unit 205A
- 3729 W Glen Dr Unit 804
- 4735 W 122nd St
- 12147 S Cicero Ave
- 3823 W 123rd St Unit 302
- 3821 W 123rd St Unit 301
- 12539 S Quinn Dr Unit 402
- 12026 S Kildare Ave Unit 16
- 4818 W 122nd St Unit 3W
- 12211 S Harding Ave
- 12749 S Kenneth Ave Unit D
- 12749 S Kenneth Ave Unit C
- 12755 S Kenneth Ave Unit H
- 12755 S Kenneth Ave Unit G
- 12755 S Kenneth Ave Unit F
- 12755 S Kenneth Ave Unit 10E
- 12755 S Kenneth Ave Unit A
- 12747 S Kenneth Ave Unit G
- 12747 S Kenneth Ave Unit E
- 12747 S Kenneth Ave Unit H
- 12747 S Kenneth Ave Unit F
- 12739 S Kenneth Ave Unit K
- 12741 S Kenneth Ave Unit B
- 12739 S Kenneth Ave Unit J
- 12741 S Kenneth Ave Unit D
- 12741 S Kenneth Ave Unit C
- 12739 S Kenneth Ave Unit I
- 12741 S Kenneth Ave Unit A
- 12739 S Kenneth Ave Unit L