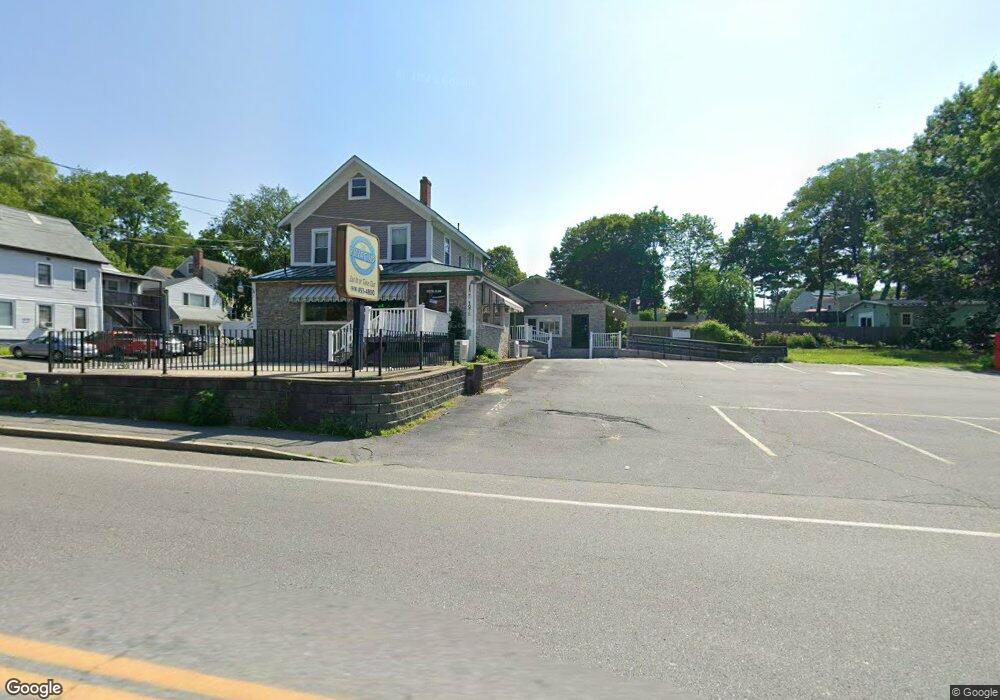
1275 Bridge St Dracut, MA 01826
Estimated Value: $1,077,790
4
Beds
2
Baths
3,238
Sq Ft
$333/Sq Ft
Est. Value
About This Home
This home is located at 1275 Bridge St, Dracut, MA 01826 and is currently estimated at $1,077,790, approximately $332 per square foot. 1275 Bridge St is a home located in Middlesex County with nearby schools including Greenmont Avenue School, Richardson Middle School, and Dracut Senior High School.
Ownership History
Date
Name
Owned For
Owner Type
Purchase Details
Closed on
Feb 16, 2006
Sold by
Breton Richard L
Bought by
Marlena Rt
Current Estimated Value
Home Financials for this Owner
Home Financials are based on the most recent Mortgage that was taken out on this home.
Original Mortgage
$440,000
Outstanding Balance
$248,143
Interest Rate
6.23%
Mortgage Type
Commercial
Estimated Equity
$824,055
Purchase Details
Closed on
Mar 6, 1997
Sold by
Breton Leo P
Bought by
Breton Richard L
Home Financials for this Owner
Home Financials are based on the most recent Mortgage that was taken out on this home.
Original Mortgage
$120,000
Interest Rate
7.77%
Mortgage Type
Commercial
Create a Home Valuation Report for This Property
The Home Valuation Report is an in-depth analysis detailing your home's value as well as a comparison with similar homes in the area
Home Values in the Area
Average Home Value in this Area
Purchase History
We collect this data history from publicly available records. To have your information removed, we recommend requesting removal directly through your county’s website.
| Date | Buyer | Sale Price | Title Company |
|---|---|---|---|
| Marlena Rt | $550,000 | -- | |
| Breton Richard L | $120,000 | -- |
Source: Public Records
Mortgage History
We collect this data history from publicly available records. To have your information removed, we recommend requesting removal directly through your county’s website.
| Date | Status | Borrower | Loan Amount |
|---|---|---|---|
| Open | Marlena Rt | $440,000 | |
| Previous Owner | Breton Richard L | $120,000 |
Source: Public Records
Tax History
| Year | Tax Paid | Tax Assessment Tax Assessment Total Assessment is a certain percentage of the fair market value that is determined by local assessors to be the total taxable value of land and additions on the property. | Land | Improvement |
|---|---|---|---|---|
| 2025 | $5,484 | $541,900 | $300,000 | $241,900 |
| 2024 | $5,311 | $508,200 | $285,700 | $222,500 |
| 2023 | $5,322 | $459,600 | $248,400 | $211,200 |
| 2022 | $5,195 | $422,700 | $225,800 | $196,900 |
| 2021 | $5,182 | $398,300 | $205,200 | $193,100 |
| 2020 | $5,237 | $392,300 | $199,200 | $193,100 |
| 2019 | $5,185 | $377,100 | $189,600 | $187,500 |
| 2018 | $5,253 | $371,500 | $189,600 | $181,900 |
| 2017 | $5,278 | $371,500 | $189,600 | $181,900 |
| 2016 | $4,893 | $329,700 | $182,300 | $147,400 |
| 2015 | $4,922 | $329,700 | $182,300 | $147,400 |
| 2014 | $4,802 | $331,400 | $182,300 | $149,100 |
Source: Public Records
Map
Nearby Homes
- 51 Willard St
- 23 18th St
- 246 Aiken Ave Unit 7
- 185 18th St
- 417 Hildreth St Unit 12
- 18 Sutherland St
- 160 Orleans St
- 112 Genest St Unit 9
- 551 Hildreth St Unit 21
- 1544 Bridge St
- 192 Hildreth St
- 4 Hazelwood Ave Unit 12
- 10 Lanseigne St
- 69 Lilley Ave
- 58 Leo Ave
- 30 Barker St
- 12 Fisher St
- 11 Lilley Ave
- 54 Hampshire St
- 337 Beacon St
Your Personal Tour Guide
Ask me questions while you tour the home.