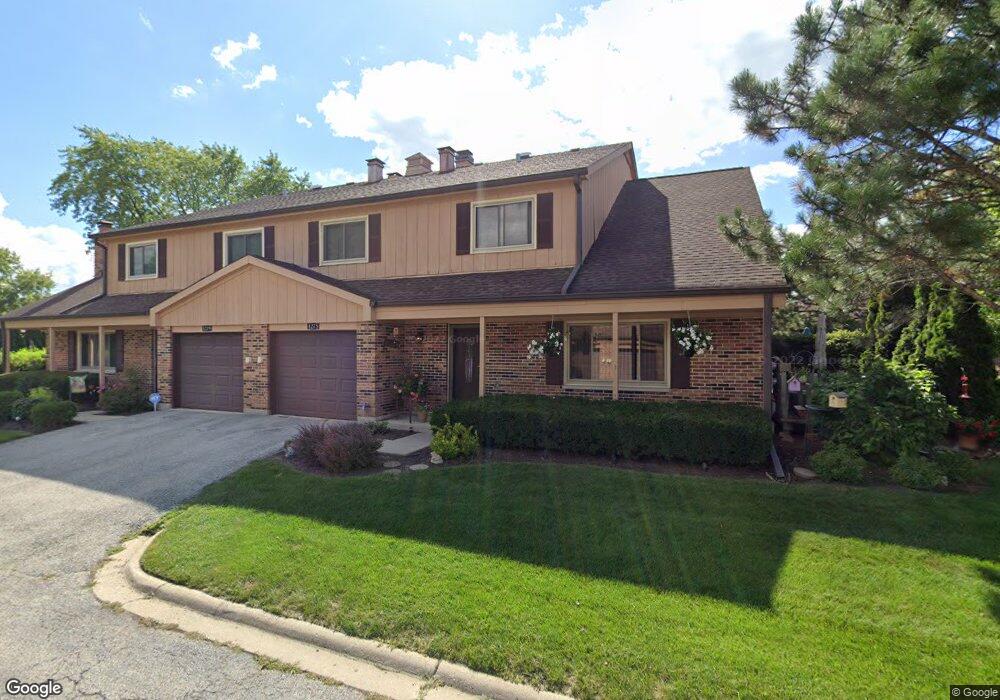
1275 E Evergreen Dr Palatine, IL 60074
Virginia Lake NeighborhoodEstimated Value: $280,000 - $307,000
2
Beds
2
Baths
1,282
Sq Ft
$226/Sq Ft
Est. Value
About This Home
This home is located at 1275 E Evergreen Dr, Palatine, IL 60074 and is currently estimated at $289,666, approximately $225 per square foot. 1275 E Evergreen Dr is a home located in Cook County with nearby schools including Jane Addams Elementary School, Palatine High School, and St Thomas Of Villanova School.
Ownership History
Date
Name
Owned For
Owner Type
Purchase Details
Closed on
Aug 22, 2005
Sold by
Peterson Justin P and Peterson Shelly
Bought by
Tomasino Valerie A
Current Estimated Value
Home Financials for this Owner
Home Financials are based on the most recent Mortgage that was taken out on this home.
Original Mortgage
$160,000
Outstanding Balance
$85,289
Interest Rate
5.89%
Mortgage Type
Fannie Mae Freddie Mac
Estimated Equity
$204,377
Purchase Details
Closed on
Aug 20, 2003
Sold by
Innes Susan E
Bought by
Peterson Justin P and Peterson Shelly
Home Financials for this Owner
Home Financials are based on the most recent Mortgage that was taken out on this home.
Original Mortgage
$152,000
Interest Rate
5.83%
Mortgage Type
Unknown
Purchase Details
Closed on
Apr 30, 1998
Sold by
Simmons Patrick J and Simmons Linda R
Bought by
Innes Susan E
Home Financials for this Owner
Home Financials are based on the most recent Mortgage that was taken out on this home.
Original Mortgage
$121,500
Interest Rate
7.2%
Create a Home Valuation Report for This Property
The Home Valuation Report is an in-depth analysis detailing your home's value as well as a comparison with similar homes in the area
Home Values in the Area
Average Home Value in this Area
Purchase History
| Date | Buyer | Sale Price | Title Company |
|---|---|---|---|
| Tomasino Valerie A | $210,000 | Multiple | |
| Peterson Justin P | $190,000 | Atg | |
| Innes Susan E | $135,000 | -- |
Source: Public Records
Mortgage History
| Date | Status | Borrower | Loan Amount |
|---|---|---|---|
| Open | Tomasino Valerie A | $160,000 | |
| Previous Owner | Peterson Justin P | $152,000 | |
| Previous Owner | Innes Susan E | $121,500 | |
| Closed | Peterson Justin P | $28,500 |
Source: Public Records
Tax History Compared to Growth
Tax History
| Year | Tax Paid | Tax Assessment Tax Assessment Total Assessment is a certain percentage of the fair market value that is determined by local assessors to be the total taxable value of land and additions on the property. | Land | Improvement |
|---|---|---|---|---|
| 2024 | $2,190 | $21,000 | $4,000 | $17,000 |
| 2023 | $2,186 | $21,000 | $4,000 | $17,000 |
| 2022 | $2,186 | $21,000 | $4,000 | $17,000 |
| 2021 | $2,414 | $17,268 | $943 | $16,325 |
| 2020 | $2,215 | $17,268 | $943 | $16,325 |
| 2019 | $2,195 | $19,294 | $943 | $18,351 |
| 2018 | $2,383 | $18,139 | $868 | $17,271 |
| 2017 | $3,678 | $18,139 | $868 | $17,271 |
| 2016 | $2,864 | $18,139 | $868 | $17,271 |
| 2015 | $3,847 | $15,145 | $792 | $14,353 |
| 2014 | $3,817 | $15,145 | $792 | $14,353 |
| 2013 | $3,702 | $15,145 | $792 | $14,353 |
Source: Public Records
Map
Nearby Homes
- 1329 E Evergreen Dr Unit 1
- 1092 E Cottonwood Way
- 1239 E Carpenter Dr
- 1149 N Cardinal Dr
- 1131 N Claremont Dr Unit 1617
- 1113 E Randville Dr
- 1324 N Geneva Dr Unit 3B
- 1133 E Sayles Dr
- 1207 E Sayles Dr
- 1000 Bayside Dr Unit 212
- 856 E Cooper Dr
- 1325 N Baldwin Ct Unit VIID1
- 1319 N Winslowe Dr Unit 303
- 2500 Bayside Dr Unit 3
- 1163 E Plate Dr
- 847 E Cooper Dr
- 1275 E Baldwin Ln Unit 507
- 1275 E Baldwin Ln Unit 601
- 1275 E Baldwin Ln Unit 408
- 1275 E Baldwin Ln Unit 504
- 1255 E Evergreen Dr
- 1279 E Evergreen Dr
- 1251 E Evergreen Dr
- 1259 E Evergreen Dr
- 1259 E Evergreen Dr Unit 1259
- 1271 E Evergreen Dr
- 1283 E Evergreen Dr
- 1309 E Evergreen Dr
- 1313 E Evergreen Dr Unit 5C
- 1287 E Evergreen Dr
- 1291 E Evergreen Dr
- 1291 E Evergreen Dr Unit 1
- 1243 E Evergreen Dr
- 1263 E Evergreen Dr
- 1247 E Evergreen Dr
- 1267 E Evergreen Dr
- 1305 E Evergreen Dr
- 1239 E Evergreen Dr
- 1223 E Evergreen Dr
- 1295 E Evergreen Dr