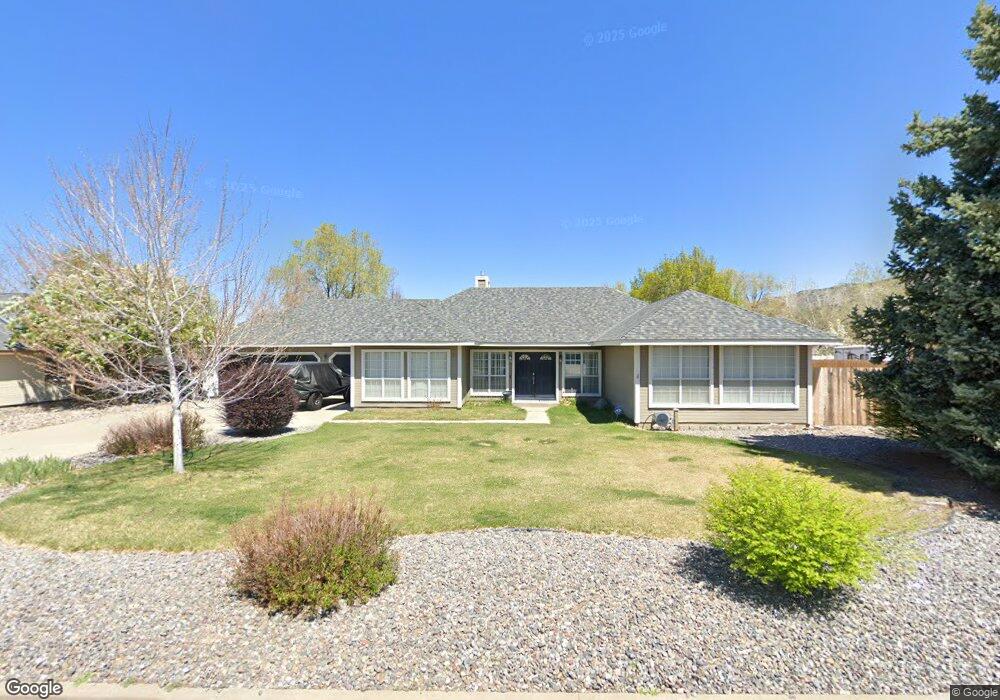
1275 High Chaparral Dr Unit 3B Reno, NV 89521
Virginia Foothills NeighborhoodEstimated Value: $751,525 - $886,000
3
Beds
2
Baths
2,070
Sq Ft
$391/Sq Ft
Est. Value
About This Home
This home is located at 1275 High Chaparral Dr Unit 3B, Reno, NV 89521 and is currently estimated at $809,131, approximately $390 per square foot. 1275 High Chaparral Dr Unit 3B is a home located in Washoe County with nearby schools including Brown Elementary School, Marce Herz Middle School, and Galena High School.
Ownership History
Date
Name
Owned For
Owner Type
Purchase Details
Closed on
Nov 13, 2017
Sold by
Smith Lynn E and Smith Ashley M
Bought by
Smith Lynn S
Current Estimated Value
Purchase Details
Closed on
Dec 3, 2010
Sold by
Hendrickson Peter C
Bought by
Smith Lynn E and Smith Ashley M
Home Financials for this Owner
Home Financials are based on the most recent Mortgage that was taken out on this home.
Original Mortgage
$272,902
Outstanding Balance
$182,853
Interest Rate
4.5%
Mortgage Type
FHA
Estimated Equity
$626,278
Purchase Details
Closed on
Mar 28, 2006
Sold by
Hendrickson Paul John
Bought by
Hendrickson Paul John and Hendrickson Scot Estelle
Purchase Details
Closed on
Jun 23, 2003
Sold by
Hendrickson Scot Estelle
Bought by
Hendrickson Paul John
Home Financials for this Owner
Home Financials are based on the most recent Mortgage that was taken out on this home.
Original Mortgage
$224,000
Interest Rate
5%
Mortgage Type
Purchase Money Mortgage
Create a Home Valuation Report for This Property
The Home Valuation Report is an in-depth analysis detailing your home's value as well as a comparison with similar homes in the area
Home Values in the Area
Average Home Value in this Area
Purchase History
| Date | Buyer | Sale Price | Title Company |
|---|---|---|---|
| Smith Lynn S | -- | None Available | |
| Smith Lynn E | $280,000 | Western Title Company | |
| Hendrickson Paul John | -- | None Available | |
| Hendrickson Paul John | $280,000 | Western Title Incorporated | |
| Hendrickson Paul John | $280,000 | Western Title Incorporated |
Source: Public Records
Mortgage History
| Date | Status | Borrower | Loan Amount |
|---|---|---|---|
| Open | Smith Lynn E | $272,902 | |
| Previous Owner | Hendrickson Paul John | $224,000 |
Source: Public Records
Tax History Compared to Growth
Tax History
| Year | Tax Paid | Tax Assessment Tax Assessment Total Assessment is a certain percentage of the fair market value that is determined by local assessors to be the total taxable value of land and additions on the property. | Land | Improvement |
|---|---|---|---|---|
| 2025 | $3,074 | $130,764 | $54,950 | $75,814 |
| 2024 | $3,074 | $131,980 | $54,950 | $77,030 |
| 2023 | $2,985 | $128,318 | $54,950 | $73,368 |
| 2022 | $2,898 | $109,557 | $48,055 | $61,502 |
| 2021 | $2,814 | $101,228 | $39,655 | $61,573 |
| 2020 | $2,729 | $101,666 | $39,655 | $62,011 |
| 2019 | $2,650 | $95,088 | $34,475 | $60,613 |
| 2018 | $2,579 | $86,017 | $26,425 | $59,592 |
| 2017 | $2,503 | $81,981 | $21,980 | $60,001 |
| 2016 | $2,437 | $82,829 | $19,705 | $63,124 |
| 2015 | $2,425 | $82,311 | $19,145 | $63,166 |
| 2014 | $2,313 | $74,891 | $14,840 | $60,051 |
| 2013 | -- | $69,286 | $10,360 | $58,926 |
Source: Public Records
Map
Nearby Homes
- 14505 Geronimo Trail
- 645 Paso Fino Ct
- 15075 Western Springs Ct
- 280 Pisces Cir
- 590 Secretariat Ct Unit 5
- 0 Kenneth Way Unit 230006476
- 597 Connemaras Ct
- 14490 Rancheros Dr
- 530 Alydar Ct
- 14690 Rancheros Dr
- 490 Miesque Ct Unit 6
- 16260 Rhyolite Cir
- 2982 Saddle Peak Dr
- 2904 Amethyst Hills Dr
- 2944 Ruby Desert Dr
- 255 Zircon Dr
- 13820 Virginia Foothills Dr
- 2964 Ruby Desert Dr
- 3036 Feathertop Dr
- 11325 Messina Ct
- 1265 High Chaparral Dr
- 14475 Shadow Hills Dr
- 1295 High Chaparral Dr
- 1255 High Chaparral Dr
- 14465 Shadow Hills Dr
- 1270 Tapadero Trail
- 1270 High Chaparral Dr
- 1270 High Chaparral Dr Unit Drive
- 1280 High Chaparral Dr
- 1260 High Chaparral Dr Unit 3B
- 1250 Tapadero Trail
- 1250 High Chaparral Dr
- 1290 Tapadero Trail
- 1230 Tapadero Trail
- 1235 High Chaparral Dr
- 1240 High Chaparral Dr
- 14495 Shadow Hills Dr
- 14480 Shadow Hills Dr
- 1230 High Chaparral Dr
- 1210 Tapadero Trail