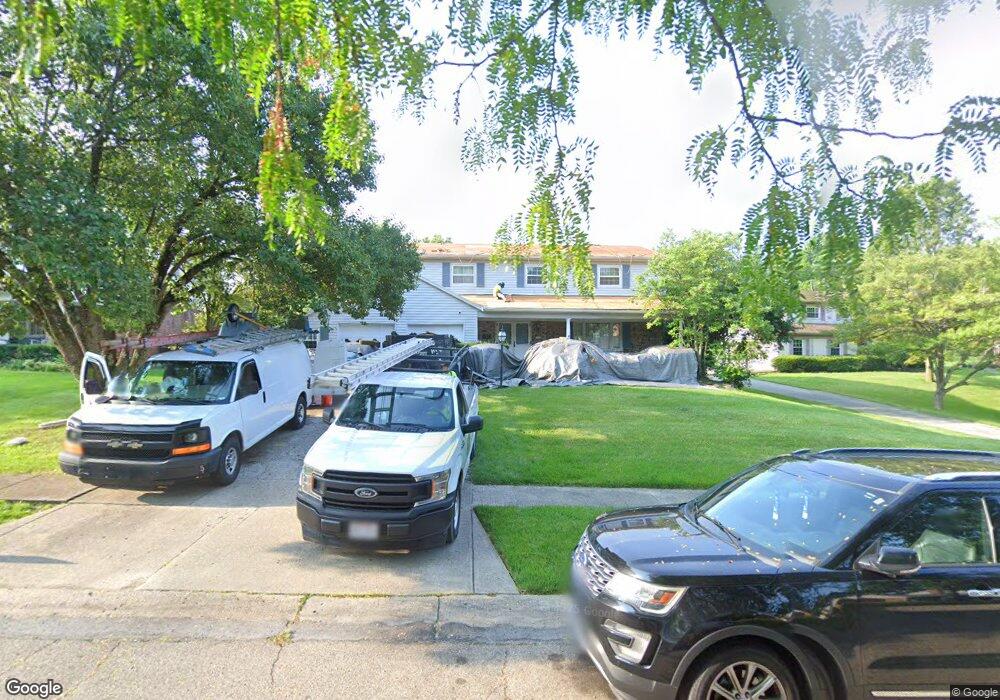
1275 Jeremy Ct Cincinnati, OH 45240
Estimated Value: $253,000 - $312,000
4
Beds
3
Baths
2,187
Sq Ft
$134/Sq Ft
Est. Value
About This Home
This home is located at 1275 Jeremy Ct, Cincinnati, OH 45240 and is currently estimated at $292,229, approximately $133 per square foot. 1275 Jeremy Ct is a home located in Hamilton County with nearby schools including Calvary Academy- The.
Ownership History
Date
Name
Owned For
Owner Type
Purchase Details
Closed on
Jul 5, 2022
Sold by
Fsh Paras Llc
Bought by
Jenkins Terrell and Jenkins Marva
Current Estimated Value
Home Financials for this Owner
Home Financials are based on the most recent Mortgage that was taken out on this home.
Original Mortgage
$199,000
Outstanding Balance
$189,342
Interest Rate
5.1%
Mortgage Type
VA
Estimated Equity
$102,887
Purchase Details
Closed on
Oct 27, 2010
Sold by
Shah Rajnikant C and Shah Vina R
Bought by
Fsh Paras Llc
Purchase Details
Closed on
May 19, 2009
Sold by
Fsh Paras Llc
Bought by
Shah Rajnikant C and Shah Vina R
Home Financials for this Owner
Home Financials are based on the most recent Mortgage that was taken out on this home.
Original Mortgage
$88,801
Interest Rate
4.86%
Mortgage Type
New Conventional
Purchase Details
Closed on
Dec 29, 2003
Sold by
Shah Rajnikant C and Shah Vina R
Bought by
Fsh Paras Llc
Create a Home Valuation Report for This Property
The Home Valuation Report is an in-depth analysis detailing your home's value as well as a comparison with similar homes in the area
Home Values in the Area
Average Home Value in this Area
Purchase History
| Date | Buyer | Sale Price | Title Company |
|---|---|---|---|
| Jenkins Terrell | $199,000 | Meyer Carl J | |
| Jenkins Terrell | $199,000 | Meyer Carl J | |
| Fsh Paras Llc | -- | -- | |
| Shah Rajnikant C | -- | None Available | |
| Fsh Paras Llc | -- | -- |
Source: Public Records
Mortgage History
| Date | Status | Borrower | Loan Amount |
|---|---|---|---|
| Open | Jenkins Terrell | $199,000 | |
| Closed | Jenkins Terrell | $199,000 | |
| Previous Owner | Shah Rajnikant C | $88,801 |
Source: Public Records
Tax History Compared to Growth
Tax History
| Year | Tax Paid | Tax Assessment Tax Assessment Total Assessment is a certain percentage of the fair market value that is determined by local assessors to be the total taxable value of land and additions on the property. | Land | Improvement |
|---|---|---|---|---|
| 2024 | $2,830 | $69,650 | $14,651 | $54,999 |
| 2023 | $2,968 | $69,650 | $14,651 | $54,999 |
| 2022 | $2,510 | $50,411 | $10,987 | $39,424 |
| 2021 | $3,988 | $50,411 | $10,987 | $39,424 |
| 2020 | $3,939 | $50,411 | $10,987 | $39,424 |
| 2019 | $3,757 | $42,011 | $9,156 | $32,855 |
| 2018 | $3,763 | $42,011 | $9,156 | $32,855 |
| 2017 | $3,668 | $42,011 | $9,156 | $32,855 |
| 2016 | $3,558 | $39,519 | $9,597 | $29,922 |
| 2015 | $3,269 | $39,519 | $9,597 | $29,922 |
| 2014 | $3,023 | $39,519 | $9,597 | $29,922 |
| 2013 | $3,482 | $46,494 | $11,291 | $35,203 |
Source: Public Records
Map
Nearby Homes
- 1251 Waycross Rd
- 11231 Lincolnshire Dr
- 1314 Waycross Rd
- 3620 Kelvin Ct
- 11315 Lincolnshire Dr
- 1136 Inner Circle Dr
- 1116 Inner Circle Dr
- 1341 Longacre Dr
- 1249 Komura Ct
- 1413 Waycross Rd
- 1429 Waycross Rd
- 1119 Imprint Ln
- 11273 Leander Ct
- 1451 Lemontree Dr
- 888 W Kemper Rd
- 1372 Kesta Place
- 77 Illona Dr
- 11233 Embassy Dr
- 11 Dewitt Ct
- 9 Dewitt Ct
- 1269 Jeremy Ct
- 1281 Jeremy Ct
- 1263 Jeremy Ct
- 11240 Lincolnshire Dr
- 11246 Lincolnshire Dr
- 1287 Jeremy Ct
- 11234 Lincolnshire Dr
- 11252 Lincolnshire Dr
- 1276 Jeremy Ct
- 1282 Jeremy Ct
- 1257 Jeremy Ct
- 1270 Jeremy Ct
- 11228 Lincolnshire Dr
- 1288 Jeremy Ct
- 1293 Jeremy Ct
- 1264 Jeremy Ct
- 11256 Lincolnshire Dr
- 1258 Jeremy Ct
- 11269 Jason Dr
- 1251 Jeremy Ct