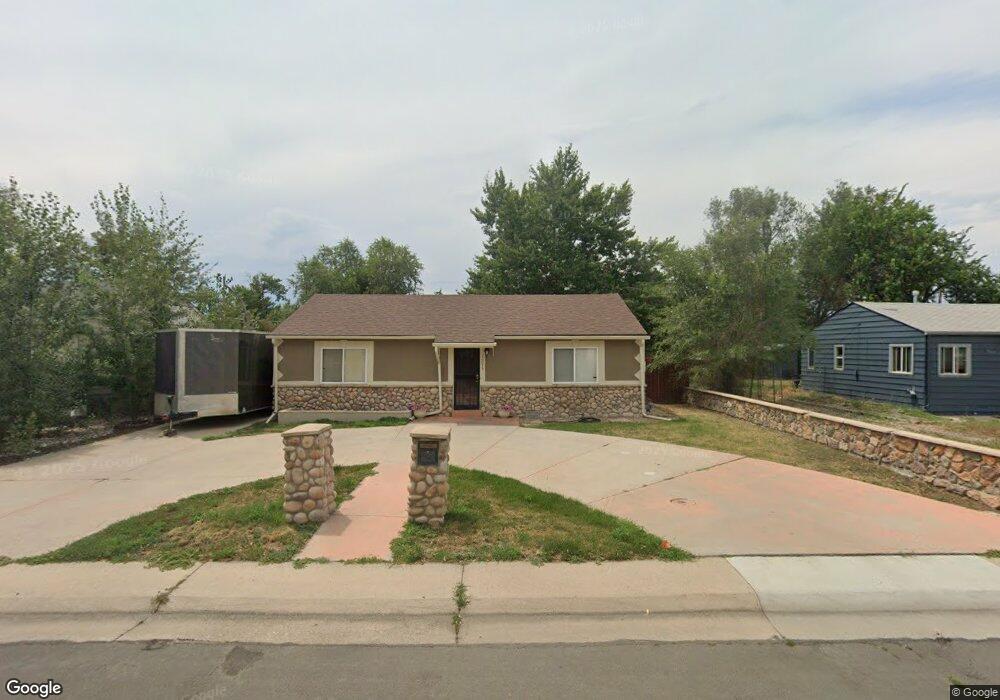
1275 S Vrain St Denver, CO 80219
Mar Lee NeighborhoodEstimated Value: $362,000 - $444,000
2
Beds
1
Bath
920
Sq Ft
$437/Sq Ft
Est. Value
About This Home
This home is located at 1275 S Vrain St, Denver, CO 80219 and is currently estimated at $402,371, approximately $437 per square foot. 1275 S Vrain St is a home located in Denver County with nearby schools including Force Elementary School, Kepner Beacon Middle School, and John F Kennedy High School.
Ownership History
Date
Name
Owned For
Owner Type
Purchase Details
Closed on
Aug 7, 2014
Sold by
Olivas Carmen and Olivas Jose
Bought by
Olivas Carmen and Marquez Meraz Erndida
Current Estimated Value
Home Financials for this Owner
Home Financials are based on the most recent Mortgage that was taken out on this home.
Original Mortgage
$142,364
Outstanding Balance
$82,905
Interest Rate
4.25%
Mortgage Type
FHA
Estimated Equity
$319,466
Purchase Details
Closed on
Dec 1, 2003
Sold by
Lopez Leonel
Bought by
Olivas Carmen and Olivas Jose
Home Financials for this Owner
Home Financials are based on the most recent Mortgage that was taken out on this home.
Original Mortgage
$172,296
Interest Rate
5.86%
Mortgage Type
Purchase Money Mortgage
Purchase Details
Closed on
May 7, 1999
Sold by
Stonebraker Margaret G and Stephen Stonebraker
Bought by
Lopez Leonel
Home Financials for this Owner
Home Financials are based on the most recent Mortgage that was taken out on this home.
Original Mortgage
$96,500
Interest Rate
6.89%
Create a Home Valuation Report for This Property
The Home Valuation Report is an in-depth analysis detailing your home's value as well as a comparison with similar homes in the area
Home Values in the Area
Average Home Value in this Area
Purchase History
| Date | Buyer | Sale Price | Title Company |
|---|---|---|---|
| Olivas Carmen | -- | Assured Title | |
| Olivas Carmen | $175,000 | -- | |
| Lopez Leonel | $99,500 | -- |
Source: Public Records
Mortgage History
| Date | Status | Borrower | Loan Amount |
|---|---|---|---|
| Open | Olivas Carmen | $142,364 | |
| Closed | Olivas Carmen | $172,296 | |
| Previous Owner | Lopez Leonel | $96,500 |
Source: Public Records
Tax History Compared to Growth
Tax History
| Year | Tax Paid | Tax Assessment Tax Assessment Total Assessment is a certain percentage of the fair market value that is determined by local assessors to be the total taxable value of land and additions on the property. | Land | Improvement |
|---|---|---|---|---|
| 2024 | $1,903 | $24,030 | $2,060 | $21,970 |
| 2023 | $1,862 | $24,030 | $2,060 | $21,970 |
| 2022 | $1,651 | $20,760 | $5,960 | $14,800 |
| 2021 | $1,593 | $21,350 | $6,130 | $15,220 |
| 2020 | $1,464 | $19,730 | $6,130 | $13,600 |
| 2019 | $1,423 | $19,730 | $6,130 | $13,600 |
| 2018 | $1,210 | $15,640 | $4,630 | $11,010 |
| 2017 | $1,206 | $15,640 | $4,630 | $11,010 |
| 2016 | $899 | $11,030 | $4,832 | $6,198 |
| 2015 | $862 | $11,030 | $4,832 | $6,198 |
| 2014 | $662 | $7,970 | $2,842 | $5,128 |
Source: Public Records
Map
Nearby Homes
- 1135 S Vrain St
- 4445 W Tennessee Ave
- 1470 S Winona Way
- 1455 S Tennyson St
- 1110 S Quitman St
- 971 S Wolff St
- 1141 S Zenobia St
- 1361 S Perry St
- 1050 S Quitman St
- 1124 S Perry St
- 1381 S Perry St
- 1255 S Patton Ct
- 1200 S Patton Ct
- 1493 S Yates St
- 1470 S Quitman St
- 1532 S Quitman St
- 1057 S Osceola St
- 960 S Perry St
- 1235 S Benton St
- 5485 W Arizona Ave
- 1285 S Vrain St
- 1265 S Vrain St
- 1295 S Vrain St
- 1260 S Vrain St
- 1280 S Vrain St
- 1270 S Vrain St
- 1245 S Vrain St
- 1280 S Winona Ct
- 1280 S Winona Ct
- 1280 S Winona Ct
- 1290 S Vrain St
- 1250 S Vrain St
- 1288 S Winona Ct
- 1260 S Winona Ct
- 1290 S Winona Ct
- 1250 S Winona Ct
- 1240 S Vrain St
- 1235 S Vrain St
- 1305 S Vrain St
- 1240 S Winona Ct