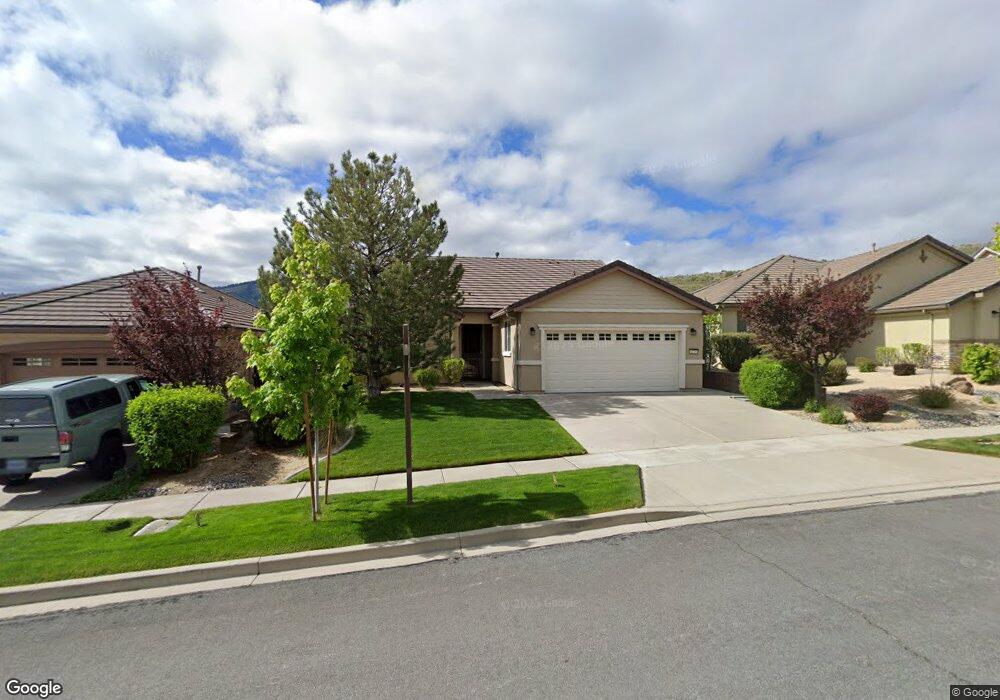
1275 Walking Stick Way Reno, NV 89523
Somersett NeighborhoodEstimated Value: $586,136 - $654,000
2
Beds
2
Baths
1,644
Sq Ft
$384/Sq Ft
Est. Value
About This Home
This home is located at 1275 Walking Stick Way, Reno, NV 89523 and is currently estimated at $630,534, approximately $383 per square foot. 1275 Walking Stick Way is a home located in Washoe County with nearby schools including B D Billinghurst Middle School and Robert McQueen High School.
Ownership History
Date
Name
Owned For
Owner Type
Purchase Details
Closed on
Oct 1, 2019
Sold by
Kyzer Stanley W and Kyzer Kathleen C
Bought by
Kyzer Stanley W and Kyzer Kathleen C
Current Estimated Value
Home Financials for this Owner
Home Financials are based on the most recent Mortgage that was taken out on this home.
Original Mortgage
$279,000
Outstanding Balance
$181,635
Interest Rate
3.5%
Mortgage Type
New Conventional
Estimated Equity
$448,899
Purchase Details
Closed on
Jan 8, 2014
Sold by
Kyzer Stan
Bought by
The Stanley W Kyzer Jr And Kathleen C Ky
Purchase Details
Closed on
Sep 7, 2007
Sold by
Pn Ii Inc
Bought by
Kyzer Stan
Home Financials for this Owner
Home Financials are based on the most recent Mortgage that was taken out on this home.
Original Mortgage
$303,256
Interest Rate
6.67%
Mortgage Type
Purchase Money Mortgage
Create a Home Valuation Report for This Property
The Home Valuation Report is an in-depth analysis detailing your home's value as well as a comparison with similar homes in the area
Home Values in the Area
Average Home Value in this Area
Purchase History
| Date | Buyer | Sale Price | Title Company |
|---|---|---|---|
| Kyzer Stanley W | -- | None Available | |
| The Stanley W Kyzer Jr And Kathleen C Ky | -- | None Available | |
| Kyzer Stan | $379,500 | First American Title |
Source: Public Records
Mortgage History
| Date | Status | Borrower | Loan Amount |
|---|---|---|---|
| Open | Kyzer Stanley W | $279,000 | |
| Closed | Kyzer Stan | $303,256 |
Source: Public Records
Tax History Compared to Growth
Tax History
| Year | Tax Paid | Tax Assessment Tax Assessment Total Assessment is a certain percentage of the fair market value that is determined by local assessors to be the total taxable value of land and additions on the property. | Land | Improvement |
|---|---|---|---|---|
| 2026 | $2,475 | $126,332 | $45,500 | $80,832 |
| 2025 | $3,214 | $124,831 | $42,805 | $82,026 |
| 2024 | $3,214 | $119,201 | $36,680 | $82,521 |
| 2023 | $3,120 | $121,063 | $43,190 | $77,873 |
| 2022 | $3,030 | $98,588 | $33,775 | $64,813 |
| 2021 | $2,942 | $90,548 | $26,215 | $64,333 |
| 2020 | $2,854 | $92,493 | $28,385 | $64,108 |
| 2019 | $2,770 | $91,394 | $30,310 | $61,084 |
| 2018 | $2,690 | $80,586 | $21,000 | $59,586 |
| 2017 | $2,613 | $79,325 | $19,775 | $59,550 |
| 2016 | $2,546 | $78,910 | $18,235 | $60,675 |
| 2015 | $2,545 | $76,369 | $15,995 | $60,374 |
| 2014 | $2,467 | $73,653 | $15,085 | $58,568 |
| 2013 | -- | $65,267 | $10,780 | $54,487 |
Source: Public Records
Map
Nearby Homes
- 9380 Copper Mountain Cir
- 1240 Cliff Park Way
- 1220 Cliff Park Way
- 1380 Wakefield Trail
- 9190 Quilberry Way
- 1170 Cliff Park Way
- 9161 Quilberry Way
- 9225 Sassafras Trail
- 9165 Kenton Trail
- 861 Larrimore Trail
- 1591 Elk Run Trail
- 0 Mountain Daisy Rd
- 0 Mountain Haven Ln
- 270 Mogul Mountain Dr
- 1590 Scott Valley Rd
- 1755 Back Nine Trail
- 1640 Scott Valley Rd
- 1671 Crescent Pointe Ct
- 35 Mogul Mountain Cir
- 8770 Lost Creek Ct
- 1265 Walking Stick Way
- 1285 Walking Stick Way
- 1255 Walking Stick Way
- 1295 Walking Stick Way
- 1245 Walking Stick Way Unit n/a
- 1245 Walking Stick Way
- 1330 Walking Stick Way
- 1320 Walking Stick Way
- 1270 Sugar Creek Trail
- 1305 Walking Stick Way
- 1280 Sugar Creek Trail
- 1235 Walking Stick Way
- 1260 Sugar Creek Trail
- 1350 Walking Stick Way
- 1305 Hidden River Way
- 1315 Hidden River Way
- 1325 Hidden River Way
- 1295 Hidden River Ct
- 9200 Walking Stick Ct
- 1250 Sugar Creek Trail