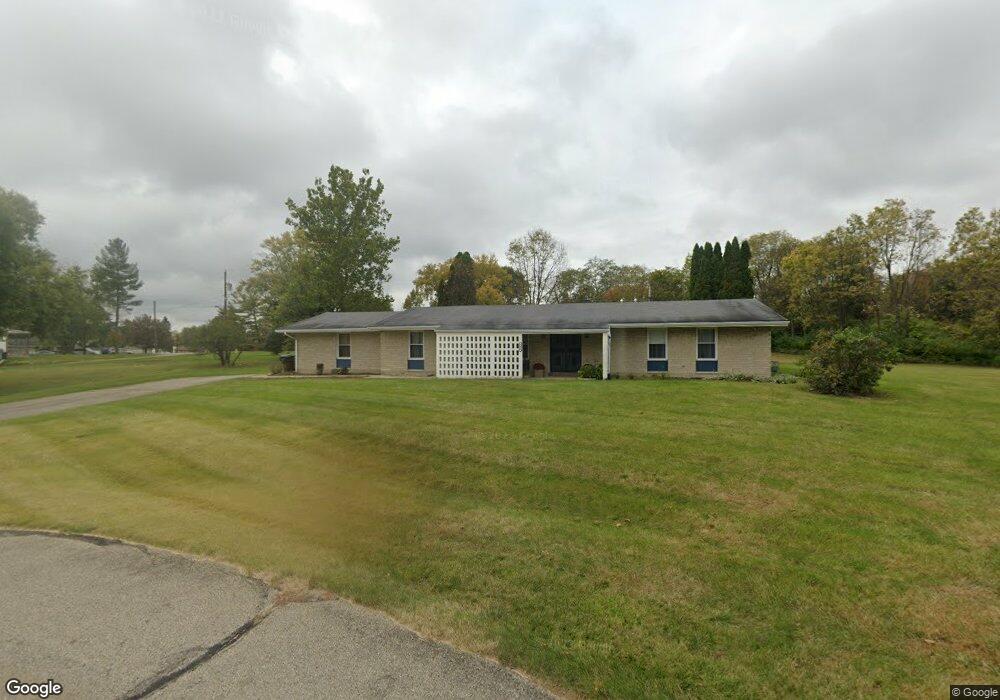
1275 Wenofred Dr Wilberforce, OH 45384
Estimated Value: $217,000 - $244,000
3
Beds
3
Baths
1,695
Sq Ft
$134/Sq Ft
Est. Value
About This Home
This home is located at 1275 Wenofred Dr, Wilberforce, OH 45384 and is currently estimated at $227,329, approximately $134 per square foot. 1275 Wenofred Dr is a home with nearby schools including Xenia High School.
Ownership History
Date
Name
Owned For
Owner Type
Purchase Details
Closed on
Aug 15, 2018
Sold by
Bankston Franklin Vivian and Bankston Vivian
Bought by
Bankston Franklin Vivian
Current Estimated Value
Home Financials for this Owner
Home Financials are based on the most recent Mortgage that was taken out on this home.
Original Mortgage
$108,000
Outstanding Balance
$65,927
Interest Rate
4.5%
Mortgage Type
VA
Estimated Equity
$161,402
Purchase Details
Closed on
Oct 18, 2010
Sold by
Bankston Vivian and Bankston Douglas J
Bought by
Bankston Vivian
Home Financials for this Owner
Home Financials are based on the most recent Mortgage that was taken out on this home.
Original Mortgage
$85,620
Interest Rate
4.63%
Mortgage Type
New Conventional
Purchase Details
Closed on
Oct 22, 1999
Sold by
Miree Paul G and Dinsmore Hayward R
Bought by
Graham Vivian
Home Financials for this Owner
Home Financials are based on the most recent Mortgage that was taken out on this home.
Original Mortgage
$96,900
Interest Rate
7.87%
Mortgage Type
VA
Create a Home Valuation Report for This Property
The Home Valuation Report is an in-depth analysis detailing your home's value as well as a comparison with similar homes in the area
Home Values in the Area
Average Home Value in this Area
Purchase History
| Date | Buyer | Sale Price | Title Company |
|---|---|---|---|
| Bankston Franklin Vivian | -- | Title Resource Group Settlem | |
| Bankston Vivian | -- | Servicelink | |
| Graham Vivian | $95,000 | -- |
Source: Public Records
Mortgage History
| Date | Status | Borrower | Loan Amount |
|---|---|---|---|
| Open | Bankston Franklin Vivian | $108,000 | |
| Closed | Bankston Vivian | $85,620 | |
| Closed | Graham Vivian | $96,900 |
Source: Public Records
Tax History Compared to Growth
Tax History
| Year | Tax Paid | Tax Assessment Tax Assessment Total Assessment is a certain percentage of the fair market value that is determined by local assessors to be the total taxable value of land and additions on the property. | Land | Improvement |
|---|---|---|---|---|
| 2024 | $2,542 | $51,660 | $5,530 | $46,130 |
| 2023 | $2,542 | $51,660 | $5,530 | $46,130 |
| 2022 | $2,173 | $39,940 | $4,840 | $35,100 |
| 2021 | $2,200 | $39,940 | $4,840 | $35,100 |
| 2020 | $2,115 | $39,940 | $4,840 | $35,100 |
| 2019 | $2,086 | $37,000 | $4,840 | $32,160 |
| 2018 | $2,093 | $37,000 | $4,840 | $32,160 |
| 2017 | $3,145 | $37,000 | $4,840 | $32,160 |
| 2016 | $3,146 | $40,120 | $4,840 | $35,280 |
| 2015 | $2,310 | $40,120 | $4,840 | $35,280 |
| 2014 | $2,676 | $40,120 | $4,840 | $35,280 |
Source: Public Records
Map
Nearby Homes
- 0 Us 42 Unit 941174
- 1287 Brush Row Rd
- 902 N Bickett Rd
- 0 Mason Rd
- 1764 Highlander Dr
- 983 Echo Ct
- 460 Kinsey Rd
- 1359 Eagles Way
- 1311 Eagles Way
- 965 Oak Dale Dr
- 1293 E Main St
- 656 Eden Roc Dr
- 0 N Patton St
- 00 N Patton St
- 610 Saxony Dr
- 513 Redbud Ln
- 508 Marshall Dr
- 568 Louise Dr
- 645 E Church St
- 612 E Market St
- 1280 Wenofred Dr
- 1259 Wenofred Dr
- 1267 Turner Place
- 1256 Turner Place
- 1244 Wenofred Dr
- 1255 Turner Place
- 1300 Wenofred Dr
- 1270 Us 42
- 1244 Turner Place
- 1251 Turner Place
- 1340 Us Route 42 S
- 1044 Wenofred Dr
- 1285 Mcginnis Dr
- 1271 Mcginnis Dr
- 0 Us 42 Unit 573217
- 0 Us 42 Unit 817998
- 1257 Mcginnis Dr
- 1068 Wilberforce Clifton Rd
- 1036 Wilberforce Clifton Rd
- 1028 Wilberforce Clifton Rd