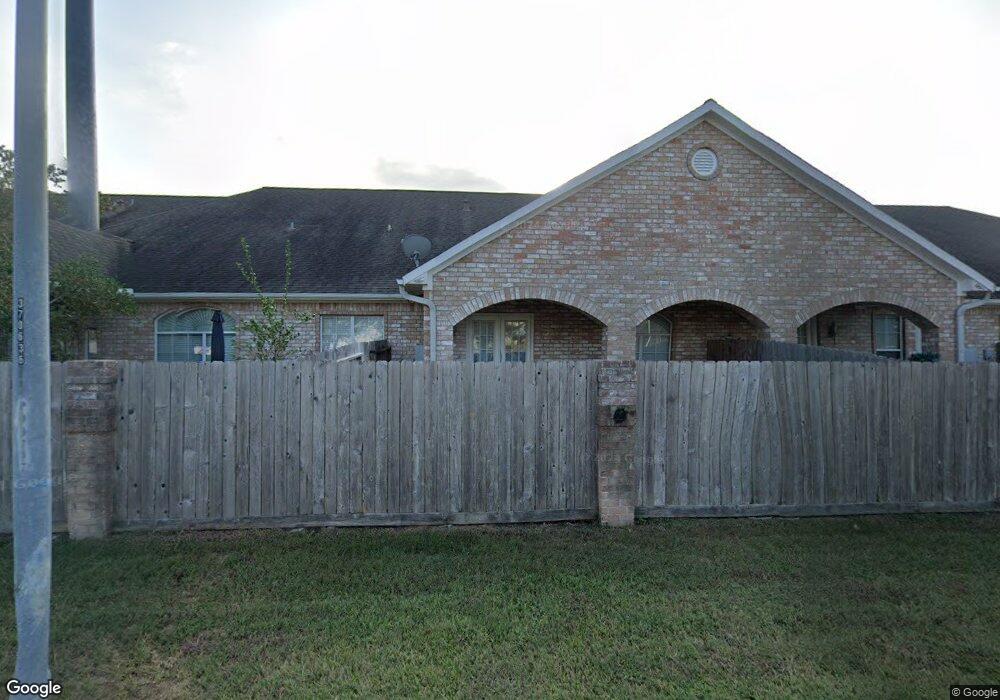
12755 Mill Ridge Dr Unit 208 Cypress, TX 77429
Estimated Value: $104,005 - $120,000
1
Bed
2
Baths
768
Sq Ft
$149/Sq Ft
Est. Value
About This Home
This home is located at 12755 Mill Ridge Dr Unit 208, Cypress, TX 77429 and is currently estimated at $114,501, approximately $149 per square foot. 12755 Mill Ridge Dr Unit 208 is a home located in Harris County with nearby schools including Millsap Elementary School, Hamilton Middle School, and Cypress Creek High School.
Ownership History
Date
Name
Owned For
Owner Type
Purchase Details
Closed on
Jul 1, 2014
Sold by
Silberman Samuel P and Silberman Vicki S
Bought by
Zeman Nancy
Current Estimated Value
Purchase Details
Closed on
Aug 27, 2010
Sold by
Orlando Craig A and Orlando Jeanene
Bought by
Silberman Samuel P and Silberman Vicki S
Home Financials for this Owner
Home Financials are based on the most recent Mortgage that was taken out on this home.
Original Mortgage
$44,800
Interest Rate
4.6%
Mortgage Type
New Conventional
Purchase Details
Closed on
Dec 20, 2007
Sold by
Saghar Qaiser
Bought by
Orlando Craig A
Home Financials for this Owner
Home Financials are based on the most recent Mortgage that was taken out on this home.
Original Mortgage
$39,900
Interest Rate
6.26%
Mortgage Type
Seller Take Back
Purchase Details
Closed on
Jun 6, 2007
Sold by
Vantage Holdings Inc
Bought by
Saghar Qaiser
Create a Home Valuation Report for This Property
The Home Valuation Report is an in-depth analysis detailing your home's value as well as a comparison with similar homes in the area
Home Values in the Area
Average Home Value in this Area
Purchase History
| Date | Buyer | Sale Price | Title Company |
|---|---|---|---|
| Zeman Nancy | -- | Stewart Title | |
| Silberman Samuel P | -- | Stewart Title Houston Div | |
| Orlando Craig A | -- | Startex Title | |
| Saghar Qaiser | $1,700 | None Available |
Source: Public Records
Mortgage History
| Date | Status | Borrower | Loan Amount |
|---|---|---|---|
| Previous Owner | Silberman Samuel P | $44,800 | |
| Previous Owner | Orlando Craig A | $39,900 |
Source: Public Records
Tax History Compared to Growth
Tax History
| Year | Tax Paid | Tax Assessment Tax Assessment Total Assessment is a certain percentage of the fair market value that is determined by local assessors to be the total taxable value of land and additions on the property. | Land | Improvement |
|---|---|---|---|---|
| 2025 | $2,437 | $114,135 | $21,686 | $92,449 |
| 2024 | $2,437 | $108,571 | $20,628 | $87,943 |
| 2023 | $2,437 | $114,550 | $21,765 | $92,785 |
| 2022 | $2,435 | $101,065 | $19,202 | $81,863 |
| 2021 | $1,912 | $75,397 | $14,325 | $61,072 |
| 2020 | $1,849 | $69,924 | $13,286 | $56,638 |
| 2019 | $1,929 | $69,924 | $13,286 | $56,638 |
| 2018 | $898 | $62,334 | $11,843 | $50,491 |
| 2017 | $1,745 | $62,334 | $11,843 | $50,491 |
| 2016 | $1,517 | $54,184 | $10,295 | $43,889 |
| 2015 | $1,379 | $54,184 | $10,295 | $43,889 |
| 2014 | $1,379 | $48,381 | $9,192 | $39,189 |
Source: Public Records
Map
Nearby Homes
- 12755 Mill Ridge Dr Unit 1103
- 12755 Mill Ridge Dr Unit 402
- 12755 Mill Ridge Dr Unit 213
- 12755 Mill Ridge Dr Unit 518
- 12755 Mill Ridge Dr Unit 101
- 12510 Costal Bend Way
- 12506 Costal Bend Way
- 12519 Costal Bend Way
- 13219 Regency Oak Ln
- 11226 Sky Ridge Dr
- 6 Oak Hollow Cir
- 12518 Sableleaf Dr
- 12506 Limber Pine Place
- 12511 Limber Pine Place
- 12418 Mill Ridge Dr
- 11202 Crooked Pine Dr
- 11110 Creekline Glen Ct
- 11111 Sprucedale Ct
- 12119 Beverly Dr
- 12119 A Beverly Dr
- 12755 Mill Ridge Dr Unit 206
- 12755 Mill Ridge Dr Unit 601
- 12755 Mill Ridge Dr Unit 113
- 12755 Mill Ridge Dr Unit 105
- 12755 Mill Ridge Dr Unit 602
- 12755 Mill Ridge Dr Unit 1203
- 12755 Mill Ridge Dr Unit 1202
- 12755 Mill Ridge Dr Unit 217
- 12755 Mill Ridge Dr Unit 606
- 12755 Mill Ridge Dr Unit 1003
- 12755 Mill Ridge Dr Unit 622
- 12755 Mill Ridge Dr Unit 308
- 12755 Mill Ridge Dr Unit 616
- 12755 Mill Ridge Dr Unit 201
- 12755 Mill Ridge Dr Unit 312
- 12755 Mill Ridge Dr Unit 202
- 12755 Mill Ridge Dr Unit 516
- 12755 Mill Ridge Dr Unit 905
- 12755 Mill Ridge Dr Unit 309
- 12755 Mill Ridge Dr Unit 1102