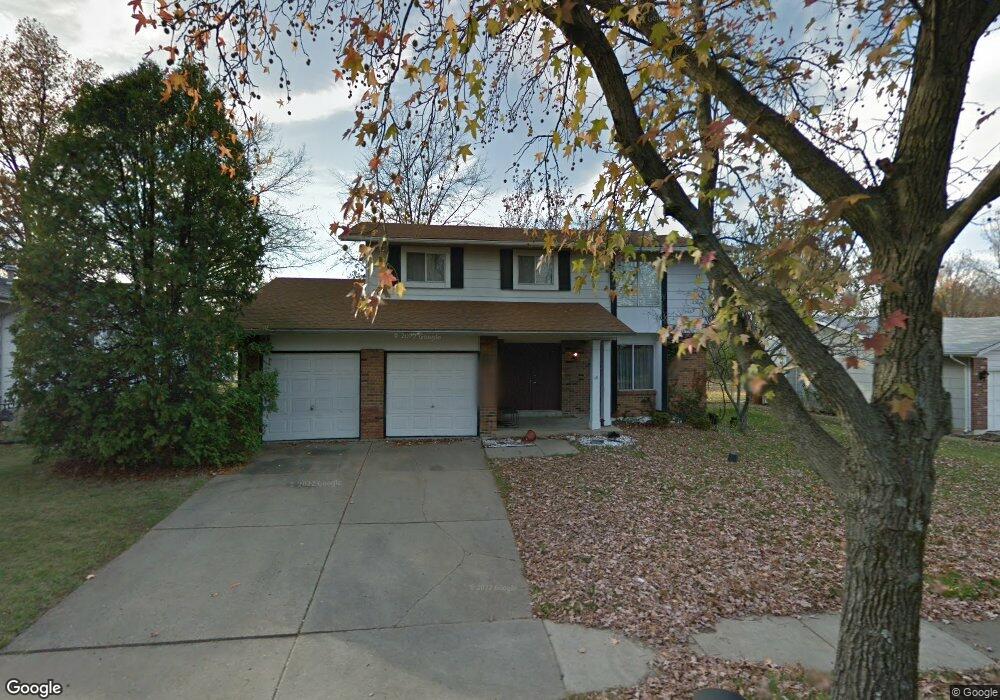
12755 Needle Point Ct Florissant, MO 63033
Estimated Value: $187,000 - $255,000
4
Beds
3
Baths
1,917
Sq Ft
$118/Sq Ft
Est. Value
About This Home
This home is located at 12755 Needle Point Ct, Florissant, MO 63033 and is currently estimated at $226,385, approximately $118 per square foot. 12755 Needle Point Ct is a home located in St. Louis County with nearby schools including Townsend Elementary School, Central Middle School, and Hazelwood Central High School.
Ownership History
Date
Name
Owned For
Owner Type
Purchase Details
Closed on
Aug 2, 2001
Sold by
Griffin Leroy Samuel
Bought by
Griffin Geraldine Denise
Current Estimated Value
Purchase Details
Closed on
Dec 21, 2000
Sold by
Best Investors Group Co
Bought by
Crayton Cheryl D
Home Financials for this Owner
Home Financials are based on the most recent Mortgage that was taken out on this home.
Original Mortgage
$123,437
Outstanding Balance
$44,996
Interest Rate
7.55%
Mortgage Type
FHA
Estimated Equity
$181,389
Purchase Details
Closed on
May 31, 2000
Sold by
United Companies Lending Corp
Bought by
Best Investors Group
Purchase Details
Closed on
Apr 17, 2000
Sold by
Rosalie Louis
Bought by
United Companies Lending Corp
Create a Home Valuation Report for This Property
The Home Valuation Report is an in-depth analysis detailing your home's value as well as a comparison with similar homes in the area
Home Values in the Area
Average Home Value in this Area
Purchase History
| Date | Buyer | Sale Price | Title Company |
|---|---|---|---|
| Griffin Geraldine Denise | -- | -- | |
| Crayton Cheryl D | $123,500 | Archway Title Agency Inc | |
| Best Investors Group | $85,000 | -- | |
| United Companies Lending Corp | $68,600 | -- |
Source: Public Records
Mortgage History
| Date | Status | Borrower | Loan Amount |
|---|---|---|---|
| Open | Crayton Cheryl D | $123,437 | |
| Closed | Crayton Cheryl D | $5,000 |
Source: Public Records
Tax History Compared to Growth
Tax History
| Year | Tax Paid | Tax Assessment Tax Assessment Total Assessment is a certain percentage of the fair market value that is determined by local assessors to be the total taxable value of land and additions on the property. | Land | Improvement |
|---|---|---|---|---|
| 2025 | $3,387 | $40,020 | $4,470 | $35,550 |
| 2024 | $3,387 | $37,240 | $3,500 | $33,740 |
| 2023 | $3,375 | $37,240 | $3,500 | $33,740 |
| 2022 | $3,041 | $29,830 | $7,750 | $22,080 |
| 2021 | $2,878 | $29,830 | $7,750 | $22,080 |
| 2020 | $2,912 | $28,120 | $6,760 | $21,360 |
| 2019 | $2,865 | $28,120 | $6,760 | $21,360 |
| 2018 | $2,337 | $21,160 | $3,910 | $17,250 |
| 2017 | $2,334 | $21,160 | $3,910 | $17,250 |
| 2016 | $2,454 | $21,900 | $3,530 | $18,370 |
| 2015 | $2,398 | $21,900 | $3,530 | $18,370 |
| 2014 | $2,116 | $19,210 | $4,370 | $14,840 |
Source: Public Records
Map
Nearby Homes
- 12750 Needle Point Ct
- 12705 Stubwood Dr
- 12456 Sea Lane Dr Unit A
- 6470 White Cap Ln Unit D
- 12435 Sea Lane Dr Unit 5
- 12225 Tarpon Dr
- 6595 Dolphin Cir E Unit 131A
- 6587 Dolphin Cir E Unit 110B
- 12713 Partridge Run Dr
- 6646 Foothills Ct
- 6665 Lakeside Hills Dr
- 12320 Missile Ln
- 12582 Springtrail Dr
- 5226 Suntrail Dr
- 12292 Jerries Ln
- 6360 Silver Fox Dr
- 12432 Quatre Dr
- 6787 Lesli Mari Ct
- 5432 Trailbend Dr
- 6250 Pennyrich Ct
- 12765 Needle Point Ct
- 12745 Needle Point Ct
- 12662 Bay Tree Dr
- 12652 Bay Tree Dr
- 12735 Needle Point Ct
- 12775 Needle Point Ct
- 12710 Stubwood Dr
- 12650 Bay Tree Dr
- 12704 Stubwood Dr
- 12760 Needle Point Ct
- 12725 Needle Point Ct
- 12730 Needle Point Ct
- 12724 Stubwood Dr
- 12642 Bay Tree Dr
- 12780 Needle Point Ct
- 12770 Needle Point Ct
- 12720 Needle Point Ct
- 12663 Bay Tree Dr
- 12715 Needle Point Ct
- 12653 Bay Tree Dr