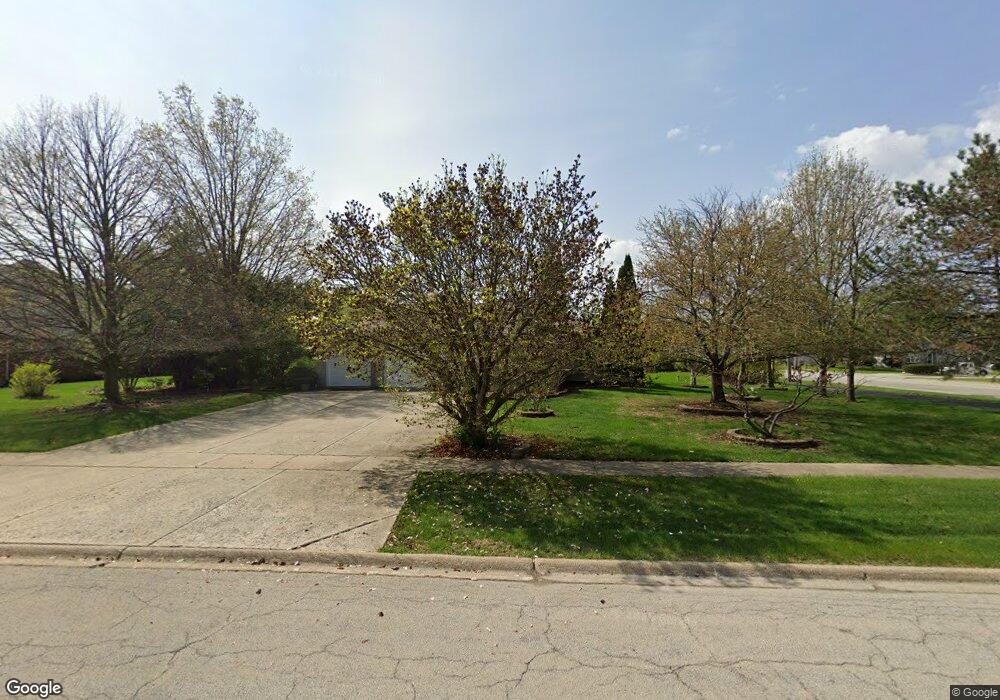
12755 W Quails Roost Dr New Lenox, IL 60451
Estimated Value: $523,000 - $605,000
--
Bed
--
Bath
--
Sq Ft
1.01
Acres
About This Home
This home is located at 12755 W Quails Roost Dr, New Lenox, IL 60451 and is currently estimated at $560,645. 12755 W Quails Roost Dr is a home located in Will County with nearby schools including Spencer Trail, Spencer Pointe, and Spencer Crossing Intermediate School.
Ownership History
Date
Name
Owned For
Owner Type
Purchase Details
Closed on
Aug 12, 2015
Sold by
Bakane Deepak and Bakane Hemlata
Bought by
Hemlata D Bakane Living Trust
Current Estimated Value
Purchase Details
Closed on
Jul 15, 2015
Sold by
Bakane Deepak
Bought by
Bakane Hemlata D and Bakane Deepak B
Purchase Details
Closed on
May 1, 1996
Sold by
Bakane Deepak
Bought by
Bakane Deepak and Bakane Hemlata D
Home Financials for this Owner
Home Financials are based on the most recent Mortgage that was taken out on this home.
Original Mortgage
$190,400
Outstanding Balance
$9,275
Interest Rate
6.37%
Estimated Equity
$551,370
Purchase Details
Closed on
Sep 8, 1994
Sold by
First United Bank
Bought by
Bakane Deepak
Home Financials for this Owner
Home Financials are based on the most recent Mortgage that was taken out on this home.
Original Mortgage
$202,500
Interest Rate
6.5%
Purchase Details
Closed on
Nov 23, 1993
Sold by
Hearthside Homes Ltd
Bought by
United Bank Of Crete Steger
Create a Home Valuation Report for This Property
The Home Valuation Report is an in-depth analysis detailing your home's value as well as a comparison with similar homes in the area
Home Values in the Area
Average Home Value in this Area
Purchase History
| Date | Buyer | Sale Price | Title Company |
|---|---|---|---|
| Hemlata D Bakane Living Trust | -- | Attorney | |
| Bakane Hemlata D | -- | Attorney | |
| Bakane Deepak | -- | -- | |
| Bakane Deepak | $225,000 | Chicago Title Insurance Co | |
| United Bank Of Crete Steger | -- | Chicago Title Insurance Co |
Source: Public Records
Mortgage History
| Date | Status | Borrower | Loan Amount |
|---|---|---|---|
| Open | Bakane Deepak | $190,400 | |
| Closed | Bakane Deepak | $202,500 |
Source: Public Records
Tax History Compared to Growth
Tax History
| Year | Tax Paid | Tax Assessment Tax Assessment Total Assessment is a certain percentage of the fair market value that is determined by local assessors to be the total taxable value of land and additions on the property. | Land | Improvement |
|---|---|---|---|---|
| 2024 | $12,378 | $174,193 | $43,221 | $130,972 |
| 2023 | $12,378 | $158,790 | $39,399 | $119,391 |
| 2022 | $11,284 | $146,283 | $36,296 | $109,987 |
| 2021 | $10,697 | $137,574 | $34,135 | $103,439 |
| 2020 | $10,379 | $132,665 | $32,917 | $99,748 |
| 2019 | $9,918 | $128,551 | $31,896 | $96,655 |
| 2018 | $9,676 | $124,119 | $30,796 | $93,323 |
| 2017 | $9,175 | $120,551 | $29,911 | $90,640 |
| 2016 | $9,315 | $117,324 | $29,110 | $88,214 |
| 2015 | $9,025 | $113,631 | $28,194 | $85,437 |
| 2014 | $9,025 | $112,228 | $27,846 | $84,382 |
| 2013 | $9,025 | $113,740 | $28,221 | $85,519 |
Source: Public Records
Map
Nearby Homes
- 1535 Glenbrooke Ln
- 701 Bishops Gate
- 641 Lisson Grove
- 709 Garadice Dr
- 214 Somerset Ct
- 651 Schooner Dr
- 1351 E Lincoln Hwy
- 2758 Bluestone Bay Dr
- 2019 Royalglen Dr
- 2848 Southwind Dr
- 2667 E Lincoln Hwy
- 1595 Glenbrooke Ln
- 1591 Glenbrooke Ln
- 1587 Glenbrooke Ln
- 911 Canongate Ln
- 1583 Glenbrooke Ln
- 1579 Glenbrooke Bldg 60 Ln
- 190 Pottawatomie Ln
- 1738 Orchard Ln
- 513 Somerset Ln
- 12743 W Quails Roost Dr
- 12756 W Quails Roost Dr
- 833 S Schoolhouse Rd
- 12740 W Quails Roost Dr
- 12740 W Quails Roost Dr
- 705 S Schoolhouse Rd
- 1990 Talon Dr
- 21342 S Covey Ct
- 901 S Schoolhouse Rd
- 21358 S Covey Ct
- 12726 W Quails Roost Dr
- 12726 W Quails Roost Dr
- 1980 Talon Dr
- 1965 Talon Dr
- 1947 Eagle Cir
- 703 S Schoolhouse Rd
- 21410 S Covey Ct
- 1939 Eagle Cir
- 911 S Schoolhouse Rd
- 1960 Talon Dr