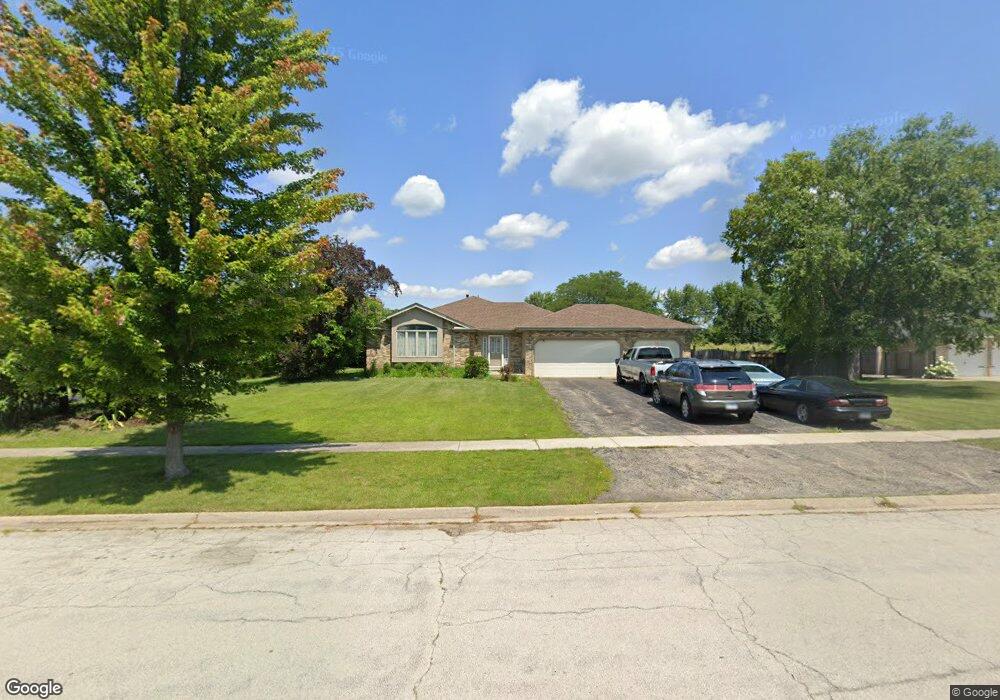
12756 W Covey Ct New Lenox, IL 60451
Estimated Value: $451,247 - $511,000
3
Beds
3
Baths
2,287
Sq Ft
$212/Sq Ft
Est. Value
About This Home
This home is located at 12756 W Covey Ct, New Lenox, IL 60451 and is currently estimated at $484,312, approximately $211 per square foot. 12756 W Covey Ct is a home located in Will County with nearby schools including Spencer Trail, Spencer Pointe, and Spencer Crossing Intermediate School.
Ownership History
Date
Name
Owned For
Owner Type
Purchase Details
Closed on
Mar 1, 2017
Sold by
Tracy Brian W and Tracy Erin N
Bought by
Lauson Katherine G and Johnson Scott
Current Estimated Value
Purchase Details
Closed on
May 8, 2012
Sold by
Chicago Title Land Trust Company
Bought by
Tracy Brian W and Tracy Erin
Home Financials for this Owner
Home Financials are based on the most recent Mortgage that was taken out on this home.
Original Mortgage
$204,000
Interest Rate
4%
Mortgage Type
New Conventional
Purchase Details
Closed on
May 17, 2006
Sold by
Spatola Paula Jean and Davis Paula Gwen
Bought by
Chicago Title Land Trust Co and Trust #15064
Purchase Details
Closed on
Aug 9, 1994
Sold by
Fordyce Lois C and Fordyce Dale H
Bought by
Fordyce Lois C and The Lois C Fordyce Living Trus
Create a Home Valuation Report for This Property
The Home Valuation Report is an in-depth analysis detailing your home's value as well as a comparison with similar homes in the area
Home Values in the Area
Average Home Value in this Area
Purchase History
| Date | Buyer | Sale Price | Title Company |
|---|---|---|---|
| Lauson Katherine G | $310,000 | Citywide Title Corporation | |
| Tracy Brian W | $255,000 | Fidelity National Title | |
| Chicago Title Land Trust Co | $365,000 | Chicago Title Insurance Co | |
| Fordyce Lois C | -- | -- |
Source: Public Records
Mortgage History
| Date | Status | Borrower | Loan Amount |
|---|---|---|---|
| Previous Owner | Tracy Brian W | $204,000 |
Source: Public Records
Tax History Compared to Growth
Tax History
| Year | Tax Paid | Tax Assessment Tax Assessment Total Assessment is a certain percentage of the fair market value that is determined by local assessors to be the total taxable value of land and additions on the property. | Land | Improvement |
|---|---|---|---|---|
| 2024 | $8,272 | $121,720 | $43,221 | $78,499 |
| 2023 | $8,272 | $110,957 | $39,399 | $71,558 |
| 2022 | $7,609 | $102,218 | $36,296 | $65,922 |
| 2021 | $7,194 | $96,133 | $34,135 | $61,998 |
| 2020 | $6,970 | $92,703 | $32,917 | $59,786 |
| 2019 | $6,651 | $89,828 | $31,896 | $57,932 |
| 2018 | $6,478 | $86,731 | $30,796 | $55,935 |
| 2017 | $6,552 | $84,238 | $29,911 | $54,327 |
| 2016 | $6,358 | $81,983 | $29,110 | $52,873 |
| 2015 | $6,153 | $79,403 | $28,194 | $51,209 |
| 2014 | $6,153 | $78,423 | $27,846 | $50,577 |
| 2013 | $6,153 | $79,480 | $28,221 | $51,259 |
Source: Public Records
Map
Nearby Homes
- 1535 Glenbrooke Ln
- 701 Bishops Gate
- 641 Lisson Grove
- 709 Garadice Dr
- 2019 Royalglen Dr
- 2758 Bluestone Bay Dr
- 651 Schooner Dr
- 214 Somerset Ct
- 1351 E Lincoln Hwy
- 2848 Southwind Dr
- 1595 Glenbrooke Ln
- 1591 Glenbrooke Ln
- 911 Canongate Ln
- 1587 Glenbrooke Ln
- 1583 Glenbrooke Ln
- 1579 Glenbrooke Bldg 60 Ln
- 2667 E Lincoln Hwy
- 1738 Orchard Ln
- Avalon Plan at Leigh Creek - Townhome
- Hampton Plan at Leigh Creek - Townhome
- 12756 W Covey Ct
- 12744 W Covey Ct
- 911 S Schoolhouse Rd
- 921 S Schoolhouse Rd
- 931 S Schoolhouse Rd
- 901 S Schoolhouse Rd
- 12755 W Covey Ct
- 21426 S Covey Ct
- 12741 W Covey Ct
- 21410 S Covey Ct
- 1990 Talon Dr
- 12725 W Covey Ct
- 21358 S Covey Ct
- 1980 Talon Dr
- 12755 W Quails Roost Dr
- 12743 W Quails Roost Dr
- 1931 Constitution Rd
- 1960 Talon Dr
- 833 S Schoolhouse Rd
- 21421 S Covey Ct