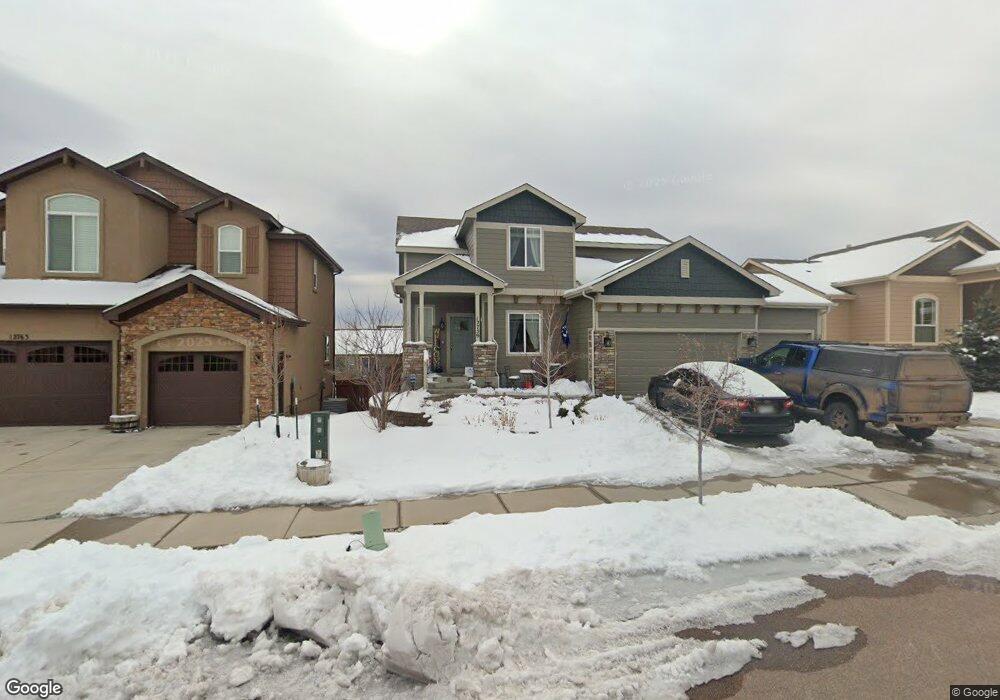
12759 Mt Oxford Place Peyton, CO 80831
Falcon NeighborhoodEstimated Value: $480,474 - $548,000
3
Beds
3
Baths
1,998
Sq Ft
$259/Sq Ft
Est. Value
About This Home
This home is located at 12759 Mt Oxford Place, Peyton, CO 80831 and is currently estimated at $518,369, approximately $259 per square foot. 12759 Mt Oxford Place is a home with nearby schools including Meridian Ranch Elementary School, Falcon Middle School, and Falcon High School.
Ownership History
Date
Name
Owned For
Owner Type
Purchase Details
Closed on
Aug 23, 2019
Sold by
Hp Colorado I Llc
Bought by
Leblanc Ian and Leblanc Tricia
Current Estimated Value
Home Financials for this Owner
Home Financials are based on the most recent Mortgage that was taken out on this home.
Original Mortgage
$339,564
Outstanding Balance
$294,579
Interest Rate
3.25%
Mortgage Type
FHA
Estimated Equity
$223,790
Purchase Details
Closed on
Aug 9, 2018
Sold by
Coleman Justin and Coleman Kristal
Bought by
Hp Colorado I Llc
Purchase Details
Closed on
Jul 14, 2014
Sold by
Sainy Aubyn Homes Llc
Bought by
Coleman Justin and Coleman Kristal
Home Financials for this Owner
Home Financials are based on the most recent Mortgage that was taken out on this home.
Original Mortgage
$283,870
Interest Rate
4.17%
Mortgage Type
VA
Create a Home Valuation Report for This Property
The Home Valuation Report is an in-depth analysis detailing your home's value as well as a comparison with similar homes in the area
Home Values in the Area
Average Home Value in this Area
Purchase History
| Date | Buyer | Sale Price | Title Company |
|---|---|---|---|
| Leblanc Ian | $345,828 | Stewart Title | |
| Hp Colorado I Llc | $322,000 | Stewart Title | |
| Coleman Justin | $283,900 | Heritage Title |
Source: Public Records
Mortgage History
| Date | Status | Borrower | Loan Amount |
|---|---|---|---|
| Open | Leblanc Ian | $339,564 | |
| Previous Owner | Coleman Justin | $283,870 |
Source: Public Records
Tax History Compared to Growth
Tax History
| Year | Tax Paid | Tax Assessment Tax Assessment Total Assessment is a certain percentage of the fair market value that is determined by local assessors to be the total taxable value of land and additions on the property. | Land | Improvement |
|---|---|---|---|---|
| 2025 | $3,051 | $32,840 | -- | -- |
| 2024 | $2,927 | $33,550 | $6,420 | $27,130 |
| 2022 | $2,492 | $24,690 | $5,020 | $19,670 |
| 2021 | $2,583 | $25,400 | $5,170 | $20,230 |
| 2020 | $2,583 | $23,550 | $4,680 | $18,870 |
| 2019 | $2,568 | $23,550 | $4,680 | $18,870 |
| 2018 | $2,410 | $21,870 | $4,280 | $17,590 |
| 2017 | $2,279 | $21,870 | $4,280 | $17,590 |
| 2016 | $2,184 | $21,460 | $4,740 | $16,720 |
| 2015 | $2,185 | $21,460 | $4,740 | $16,720 |
| 2014 | $433 | $4,200 | $4,200 | $0 |
Source: Public Records
Map
Nearby Homes
- 12667 Wheeler Peak Dr
- 10525 Mount Sherman Way
- 12698 Culebra Peak Dr
- 10553 Mt Lincoln Dr
- 10398 Mount Evans Dr
- 10388 Mount Wilson Place
- 10368 Mount Evans Dr
- 12459 Handles Peak Way
- 10751 Shavano Peak Ct
- 10835 Evening Creek Dr
- 10433 Capital Peak Way
- 10765 Rolling Mesa Dr
- 13154 Crooked Hill Dr
- 13148 Park Meadows Dr
- 13165 Crooked Hill Dr
- 10223 Capital Peak Way
- 10839 Rolling Peaks Dr
- 12860 Stone Valley Dr
- 12868 Stone Valley Dr
- 11045 Rolling Mesa Dr
- 12755 Mount Oxford Place
- 12763 Mt Oxford Place
- 12758 Mt Harvard Dr
- 12754 Mt Harvard Dr
- 12751 Mt Oxford Place
- 12771 Mt Oxford Place
- 12760 Mount Oxford Place
- 12762 Mount Harvard Dr
- 12747 Mt Oxford Place
- 12750 Mount Harvard Dr
- 12764 Mt Oxford Place
- 12775 Mt Oxford Place
- 12756 Mt Oxford Place
- 12746 Mt Harvard Dr
- 12766 Mt Harvard Dr
- 12768 Mt Oxford Place
- 12752 Mt Oxford Place
- 12743 Mount Oxford Place
- 12772 Mount Oxford Place
- 12742 Mount Harvard Dr