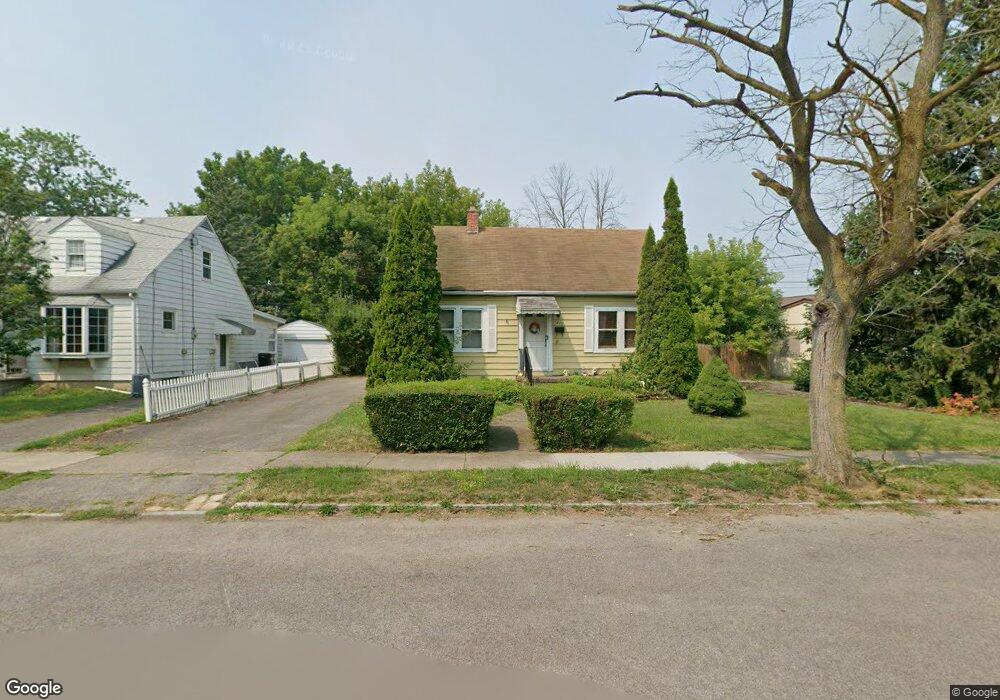
1276 88th St Niagara Falls, NY 14304
LaSalle NeighborhoodEstimated Value: $166,000 - $195,189
3
Beds
1
Bath
1,152
Sq Ft
$157/Sq Ft
Est. Value
About This Home
This home is located at 1276 88th St, Niagara Falls, NY 14304 and is currently estimated at $181,047, approximately $157 per square foot. 1276 88th St is a home located in Niagara County with nearby schools including Niagara Falls High School, Catholic Academy Of Niagara Falls - Elementary, and Christ the King Preparatory Academy.
Ownership History
Date
Name
Owned For
Owner Type
Purchase Details
Closed on
May 23, 2007
Sold by
Hooper Russell O
Bought by
Paulson Darlene
Current Estimated Value
Home Financials for this Owner
Home Financials are based on the most recent Mortgage that was taken out on this home.
Original Mortgage
$71,354
Interest Rate
6.54%
Mortgage Type
FHA
Purchase Details
Closed on
May 28, 1999
Sold by
Bebee Mark A and Bebee Theresa M
Bought by
Hooper Russell O and Hooper Cathy L
Create a Home Valuation Report for This Property
The Home Valuation Report is an in-depth analysis detailing your home's value as well as a comparison with similar homes in the area
Home Values in the Area
Average Home Value in this Area
Purchase History
| Date | Buyer | Sale Price | Title Company |
|---|---|---|---|
| Paulson Darlene | $74,000 | John Mattio | |
| Hooper Russell O | $62,300 | -- | |
| Hooper Russell O | -- | Tisdale Melanie |
Source: Public Records
Mortgage History
| Date | Status | Borrower | Loan Amount |
|---|---|---|---|
| Previous Owner | Paulson Darlene | $71,354 |
Source: Public Records
Tax History Compared to Growth
Tax History
| Year | Tax Paid | Tax Assessment Tax Assessment Total Assessment is a certain percentage of the fair market value that is determined by local assessors to be the total taxable value of land and additions on the property. | Land | Improvement |
|---|---|---|---|---|
| 2024 | $4,145 | $71,200 | $6,300 | $64,900 |
| 2023 | $2,769 | $71,200 | $6,300 | $64,900 |
| 2022 | $2,083 | $71,200 | $6,300 | $64,900 |
| 2021 | $2,082 | $71,200 | $6,300 | $64,900 |
| 2020 | $1,382 | $71,200 | $6,300 | $64,900 |
| 2019 | $1,326 | $71,200 | $6,300 | $64,900 |
| 2018 | $995 | $71,200 | $6,300 | $64,900 |
| 2017 | $1,326 | $71,200 | $6,300 | $64,900 |
| 2016 | $1,456 | $71,200 | $6,300 | $64,900 |
| 2015 | -- | $71,200 | $6,300 | $64,900 |
| 2014 | -- | $71,200 | $6,300 | $64,900 |
Source: Public Records
Map
Nearby Homes