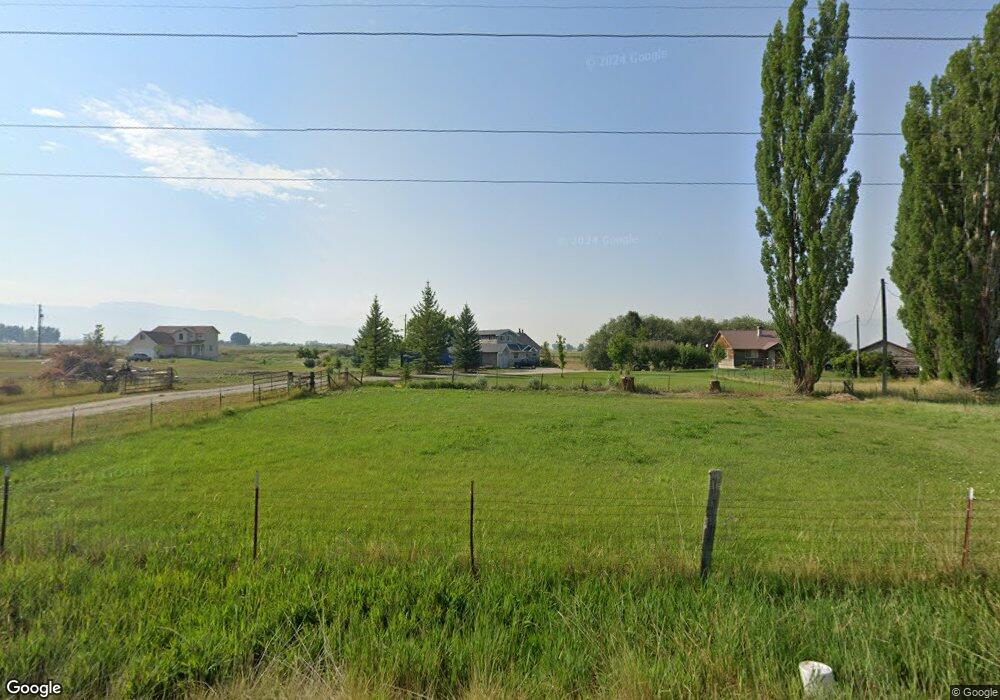
1276 W 6600 N Smithfield, UT 84335
Estimated Value: $542,000 - $590,000
--
Bed
--
Bath
1,800
Sq Ft
$317/Sq Ft
Est. Value
About This Home
This home is located at 1276 W 6600 N, Smithfield, UT 84335 and is currently estimated at $569,706, approximately $316 per square foot. 1276 W 6600 N is a home with nearby schools including Birch Creek School, North Cache Middle School, and White Pine Middle School.
Ownership History
Date
Name
Owned For
Owner Type
Purchase Details
Closed on
Nov 3, 2005
Sold by
Nielson Joseph Mark and Nielson Patricia H
Bought by
Spendlove Benjamin and Spendlove Annmarie
Current Estimated Value
Home Financials for this Owner
Home Financials are based on the most recent Mortgage that was taken out on this home.
Original Mortgage
$136,000
Outstanding Balance
$71,981
Interest Rate
5.68%
Mortgage Type
New Conventional
Estimated Equity
$497,725
Purchase Details
Closed on
Oct 24, 2005
Sold by
E W Farms Llc
Bought by
Nielson Joseph Mark and Nielson Patricia H
Home Financials for this Owner
Home Financials are based on the most recent Mortgage that was taken out on this home.
Original Mortgage
$136,000
Outstanding Balance
$71,981
Interest Rate
5.68%
Mortgage Type
New Conventional
Estimated Equity
$497,725
Purchase Details
Closed on
Jul 11, 2005
Sold by
E W Farms Llc
Bought by
E W Farms Llc
Create a Home Valuation Report for This Property
The Home Valuation Report is an in-depth analysis detailing your home's value as well as a comparison with similar homes in the area
Home Values in the Area
Average Home Value in this Area
Purchase History
| Date | Buyer | Sale Price | Title Company |
|---|---|---|---|
| Spendlove Benjamin | -- | Cache Title Company | |
| Nielson Joseph Mark | -- | Cache Title Company | |
| E W Farms Llc | -- | Hickman Land Title Company |
Source: Public Records
Mortgage History
| Date | Status | Borrower | Loan Amount |
|---|---|---|---|
| Open | Nielson Joseph Mark | $136,000 |
Source: Public Records
Tax History Compared to Growth
Tax History
| Year | Tax Paid | Tax Assessment Tax Assessment Total Assessment is a certain percentage of the fair market value that is determined by local assessors to be the total taxable value of land and additions on the property. | Land | Improvement |
|---|---|---|---|---|
| 2025 | $2,012 | $328,825 | $0 | $0 |
| 2024 | $1,896 | $286,805 | $0 | $0 |
| 2023 | $2,018 | $285,470 | $0 | $0 |
| 2022 | $2,111 | $285,470 | $0 | $0 |
| 2021 | $2,051 | $417,610 | $111,850 | $305,760 |
| 2020 | $1,913 | $366,650 | $111,850 | $254,800 |
| 2019 | $1,502 | $270,827 | $78,270 | $192,557 |
| 2018 | $1,381 | $241,454 | $78,270 | $163,184 |
| 2017 | $1,342 | $127,805 | $0 | $0 |
| 2016 | $1,358 | $127,805 | $0 | $0 |
| 2015 | $1,355 | $127,805 | $0 | $0 |
| 2014 | $1,123 | $109,215 | $0 | $0 |
| 2013 | -- | $109,215 | $0 | $0 |
Source: Public Records
Map
Nearby Homes
- 1246 W 6600 N
- 662 W 650 N
- 674 W 650 N
- 544 N 800 W
- 771 W 600 N
- 767 W 600 N
- 527 N 770 W
- 560 N 770 W Unit 83
- 353 N 770 W
- 631 W 550 N
- Rosewood Plan at The Village at Fox Meadows - Smithfield (Townhomes)
- Huckleberry Plan at The Village at Fox Meadows - Smithfield (Townhomes)
- Rosewood w/ Unfinished Basement Plan at The Village at Fox Meadows - Smithfield (Townhomes)
- Huckleberry w/ Unfinished Basement Plan at The Village at Fox Meadows - Smithfield (Townhomes)
- 698 N 650 W Unit 640
- Madison Plan at The Village at Fox Meadows - Smithfield
- Hawthorne Plan at The Village at Fox Meadows - Smithfield
- Hilldale - No Basement Plan at The Village at Fox Meadows - Smithfield
- Hayden - No Basement Plan at The Village at Fox Meadows - Smithfield
- Lyndhurst Plan at The Village at Fox Meadows - Smithfield