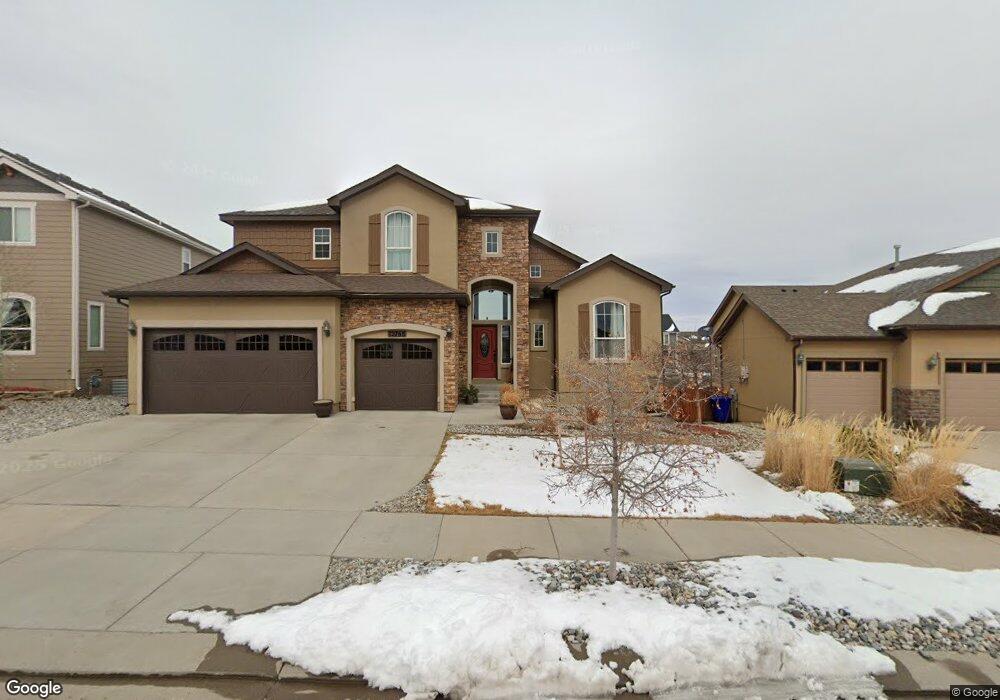
12768 Mt Oxford Place Peyton, CO 80831
Falcon NeighborhoodEstimated Value: $582,065 - $667,000
6
Beds
4
Baths
2,265
Sq Ft
$275/Sq Ft
Est. Value
About This Home
This home is located at 12768 Mt Oxford Place, Peyton, CO 80831 and is currently estimated at $623,516, approximately $275 per square foot. 12768 Mt Oxford Place is a home with nearby schools including Meridian Ranch Elementary School, Clifford Street Elementary School, and Falcon Middle School.
Ownership History
Date
Name
Owned For
Owner Type
Purchase Details
Closed on
Jan 7, 2022
Sold by
Walker Richard A
Bought by
Walker Raegan E
Current Estimated Value
Home Financials for this Owner
Home Financials are based on the most recent Mortgage that was taken out on this home.
Original Mortgage
$391,600
Outstanding Balance
$360,624
Interest Rate
3.05%
Mortgage Type
New Conventional
Estimated Equity
$262,892
Purchase Details
Closed on
May 2, 2014
Sold by
Saint Aubyn Homes Llc
Bought by
Walker Richard A and Walker Raegan E
Home Financials for this Owner
Home Financials are based on the most recent Mortgage that was taken out on this home.
Original Mortgage
$343,729
Interest Rate
4.36%
Mortgage Type
New Conventional
Create a Home Valuation Report for This Property
The Home Valuation Report is an in-depth analysis detailing your home's value as well as a comparison with similar homes in the area
Home Values in the Area
Average Home Value in this Area
Purchase History
| Date | Buyer | Sale Price | Title Company |
|---|---|---|---|
| Walker Raegan E | -- | Land Title Guarantee Company | |
| Walker Raegan E | -- | Land Title Guarantee Company | |
| Walker Richard A | $361,800 | Heritage Title |
Source: Public Records
Mortgage History
| Date | Status | Borrower | Loan Amount |
|---|---|---|---|
| Open | Walker Raegan E | $391,600 | |
| Closed | Walker Raegan E | $391,600 | |
| Closed | Walker Richard A | $343,729 |
Source: Public Records
Tax History Compared to Growth
Tax History
| Year | Tax Paid | Tax Assessment Tax Assessment Total Assessment is a certain percentage of the fair market value that is determined by local assessors to be the total taxable value of land and additions on the property. | Land | Improvement |
|---|---|---|---|---|
| 2025 | $3,924 | $41,150 | -- | -- |
| 2024 | $3,793 | $41,990 | $6,420 | $35,570 |
| 2022 | $2,972 | $29,450 | $5,020 | $24,430 |
| 2021 | $3,081 | $30,300 | $5,170 | $25,130 |
| 2020 | $3,041 | $27,730 | $4,680 | $23,050 |
| 2019 | $3,024 | $27,730 | $4,680 | $23,050 |
| 2018 | $2,826 | $25,650 | $4,280 | $21,370 |
| 2017 | $2,673 | $25,650 | $4,280 | $21,370 |
| 2016 | $2,941 | $28,900 | $4,740 | $24,160 |
| 2015 | $2,805 | $27,550 | $4,740 | $22,810 |
| 2014 | $2,757 | $26,750 | $4,780 | $21,970 |
Source: Public Records
Map
Nearby Homes
- 12667 Wheeler Peak Dr
- 12698 Culebra Peak Dr
- 10525 Mount Sherman Way
- 10751 Shavano Peak Ct
- 10553 Mt Lincoln Dr
- 10835 Evening Creek Dr
- 10398 Mount Evans Dr
- 10388 Mount Wilson Place
- 10368 Mount Evans Dr
- 12459 Handles Peak Way
- 10765 Rolling Mesa Dr
- 10433 Capital Peak Way
- 12756 Sunrise Ridge Dr
- 13154 Crooked Hill Dr
- 11045 Rolling Mesa Dr
- 13165 Crooked Hill Dr
- 10863 Rolling Peaks Dr
- 10853 Torreys Peak Way
- 10965 Long Summer Ct
- 13015 Monument Vista Dr
- 12764 Mt Oxford Place
- 12772 Mount Oxford Place
- 12760 Mount Oxford Place
- 12776 Mt Oxford Place
- 12756 Mt Oxford Place
- 12771 Mt Oxford Place
- 12763 Wheeler Peak Dr
- 12751 Wheeler Peak Dr
- 12775 Mt Oxford Place
- 12759 Mt Oxford Place
- 12739 Wheeler Peak Dr
- 12780 Mt Oxford Place
- 12763 Mt Oxford Place
- 12727 Wheeler Peak Dr
- 12752 Mt Oxford Place
- 12779 Mt Oxford Place
- 12755 Mount Oxford Place
- 12715 Wheeler Peak Dr
- 12784 Mt Oxford Place
- 12762 Mount Harvard Dr