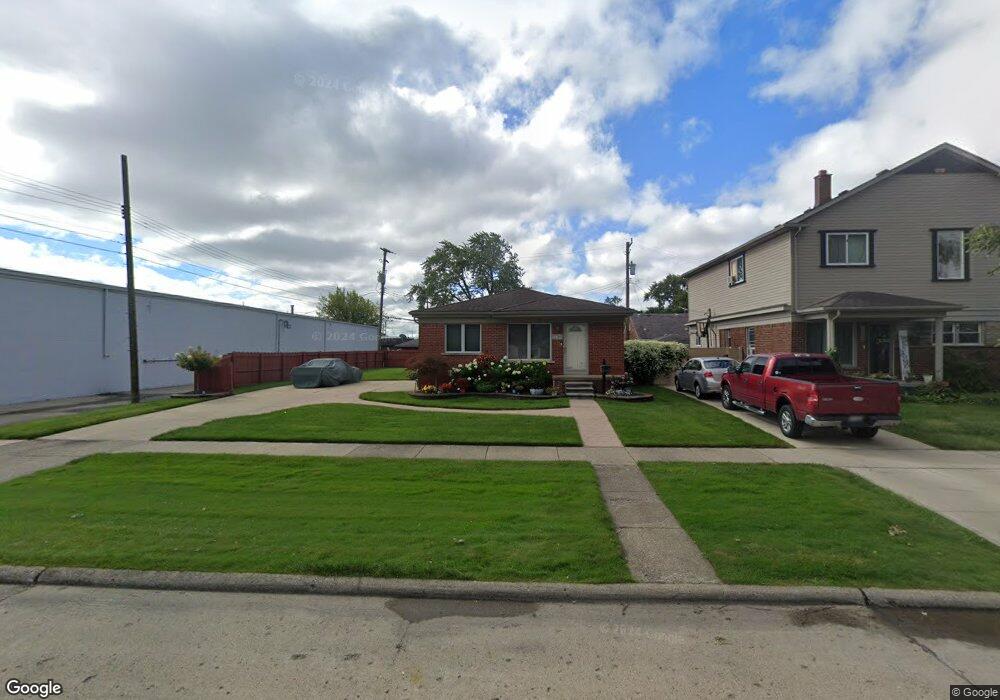
12769 Rosedale St Southgate, MI 48195
Estimated Value: $183,156 - $208,000
--
Bed
--
Bath
1,060
Sq Ft
$185/Sq Ft
Est. Value
About This Home
This home is located at 12769 Rosedale St, Southgate, MI 48195 and is currently estimated at $196,039, approximately $184 per square foot. 12769 Rosedale St is a home located in Wayne County with nearby schools including Grogan Elementary School, Davidson Middle School, and Southgate Anderson High School.
Ownership History
Date
Name
Owned For
Owner Type
Purchase Details
Closed on
Oct 14, 2004
Sold by
Geftos Keri Ann and Geftos Keri
Bought by
Geftos Steve
Current Estimated Value
Home Financials for this Owner
Home Financials are based on the most recent Mortgage that was taken out on this home.
Original Mortgage
$90,000
Interest Rate
5.5%
Mortgage Type
New Conventional
Purchase Details
Closed on
Jun 14, 2004
Sold by
Geftos Keri Ann
Bought by
Geftos Steve
Home Financials for this Owner
Home Financials are based on the most recent Mortgage that was taken out on this home.
Original Mortgage
$50,000
Interest Rate
5.87%
Mortgage Type
New Conventional
Purchase Details
Closed on
Dec 29, 2003
Sold by
Geftos Steve and Geftos Valerie
Bought by
Geftos Steve
Purchase Details
Closed on
Jul 15, 1999
Sold by
Geftos Steve
Bought by
Geftos Steve
Create a Home Valuation Report for This Property
The Home Valuation Report is an in-depth analysis detailing your home's value as well as a comparison with similar homes in the area
Home Values in the Area
Average Home Value in this Area
Purchase History
| Date | Buyer | Sale Price | Title Company |
|---|---|---|---|
| Geftos Steve | -- | Devon Title Agency | |
| Geftos Keri Ann | -- | Devon Title Agency | |
| Geftos Steve | -- | Devon Title Agency | |
| Geftos Keri Ann | -- | Devon Title Agency | |
| Geftos Steve | -- | -- | |
| Geftos Steve | -- | Multiple |
Source: Public Records
Mortgage History
| Date | Status | Borrower | Loan Amount |
|---|---|---|---|
| Closed | Geftos Keri Ann | $90,000 | |
| Closed | Geftos Keri Ann | $50,000 |
Source: Public Records
Tax History Compared to Growth
Tax History
| Year | Tax Paid | Tax Assessment Tax Assessment Total Assessment is a certain percentage of the fair market value that is determined by local assessors to be the total taxable value of land and additions on the property. | Land | Improvement |
|---|---|---|---|---|
| 2025 | $2,412 | $91,500 | $0 | $0 |
| 2024 | $2,412 | $83,000 | $0 | $0 |
| 2023 | $2,298 | $76,600 | $0 | $0 |
| 2022 | $2,657 | $69,800 | $0 | $0 |
| 2021 | $2,587 | $63,600 | $0 | $0 |
| 2020 | $2,544 | $57,900 | $0 | $0 |
| 2019 | $2,513 | $54,100 | $0 | $0 |
| 2018 | $1,920 | $48,500 | $0 | $0 |
| 2017 | $1,123 | $45,700 | $0 | $0 |
| 2016 | $2,325 | $45,100 | $0 | $0 |
| 2015 | $3,984 | $42,500 | $0 | $0 |
| 2013 | $3,860 | $39,300 | $0 | $0 |
| 2012 | $1,678 | $37,700 | $11,500 | $26,200 |
Source: Public Records
Map
Nearby Homes
- 13105 Oakdale St
- 12945 Brest St
- 1679 23rd St
- 1645 22nd St
- 13296 Rosedale St
- 4194 Drouillard St
- 13344 Birrell St
- 13272 Callender St
- 13357 Brest St
- 1125 Harrison Blvd
- 4123 Lafayette Blvd
- 1919 Goddard St
- 4118 Hubbard Ave
- 13427 Brest St
- 1136 18th St
- 1072 Harrison Blvd
- 13487 Brest St
- 1439 18th St
- 12925 Pullman St
- 12937 Pullman St
- 12791 Rosedale St
- 12805 Rosedale St
- 12812 Birrell St Unit Bldg-Unit
- 12812 Birrell St
- 12824 Birrell St
- 12817 Rosedale St
- 12800 Birrell St
- 12436 Fort St
- 12848 Birrell St
- 12774 Rosedale St
- 12792 Rosedale St
- 12860 Birrell St
- 12804 Rosedale St
- 12872 Birrell St
- 12839 Rosedale St
- 12828 Rosedale St
- 12890 Birrell St
- 12840 Rosedale St
- 12865 Rosedale St
- 12813 Birrell St