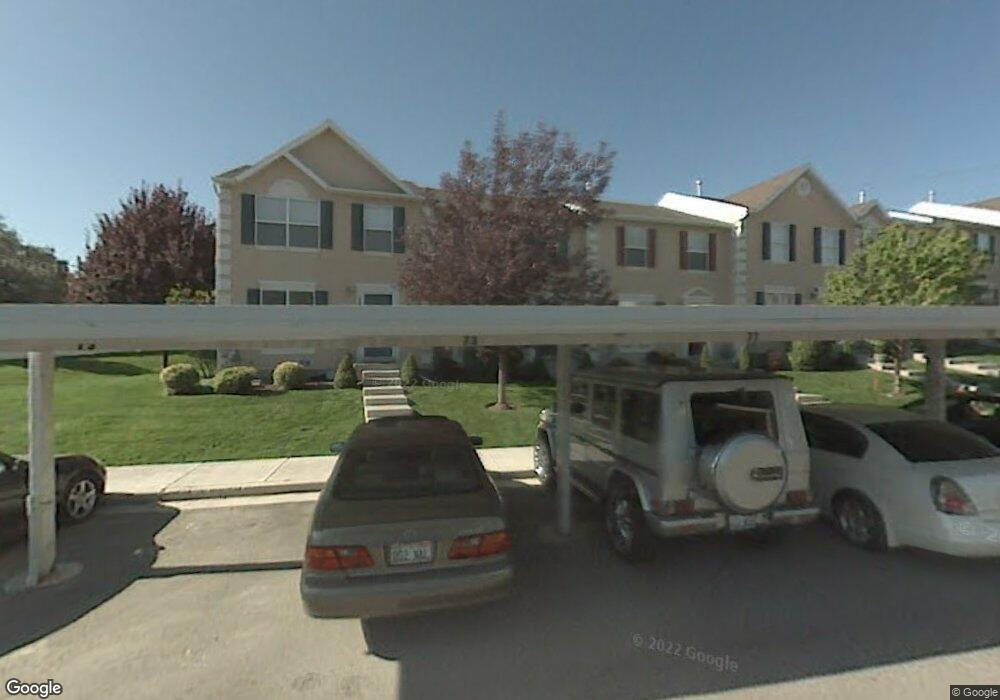
1277 Glengyle Ct Salt Lake City, UT 84123
Estimated Value: $379,000 - $406,000
3
Beds
2
Baths
1,668
Sq Ft
$237/Sq Ft
Est. Value
About This Home
This home is located at 1277 Glengyle Ct, Salt Lake City, UT 84123 and is currently estimated at $395,474, approximately $237 per square foot. 1277 Glengyle Ct is a home located in Salt Lake County with nearby schools including Longview Elementary School, Riverview Junior High School, and Murray High School.
Ownership History
Date
Name
Owned For
Owner Type
Purchase Details
Closed on
Aug 24, 2016
Sold by
Brown John Lee
Bought by
Brown John and Brown Morgan
Current Estimated Value
Home Financials for this Owner
Home Financials are based on the most recent Mortgage that was taken out on this home.
Original Mortgage
$158,819
Outstanding Balance
$126,473
Interest Rate
3.42%
Mortgage Type
FHA
Estimated Equity
$269,001
Purchase Details
Closed on
Feb 19, 2014
Sold by
Brown John
Bought by
Brown John and Brown Morgan
Home Financials for this Owner
Home Financials are based on the most recent Mortgage that was taken out on this home.
Original Mortgage
$159,065
Interest Rate
4.47%
Mortgage Type
FHA
Purchase Details
Closed on
Feb 12, 2014
Sold by
Payne Matthew A
Bought by
Brown John
Home Financials for this Owner
Home Financials are based on the most recent Mortgage that was taken out on this home.
Original Mortgage
$159,065
Interest Rate
4.47%
Mortgage Type
FHA
Purchase Details
Closed on
May 24, 2011
Sold by
Federal Home Loan Mortgage Corporation
Bought by
Payne Matthew A
Home Financials for this Owner
Home Financials are based on the most recent Mortgage that was taken out on this home.
Original Mortgage
$133,429
Interest Rate
4.84%
Mortgage Type
FHA
Purchase Details
Closed on
Dec 16, 2010
Sold by
Aurora Loan Services Llc
Bought by
Federal Home Loan Mortgage Corp
Purchase Details
Closed on
Oct 5, 2010
Sold by
Gonzalez Leah K
Bought by
Aurora Loan Services Llc
Purchase Details
Closed on
Mar 28, 2007
Sold by
Hasebi Sheena L and Williamson Sheena
Bought by
Gonzalez Leah K
Home Financials for this Owner
Home Financials are based on the most recent Mortgage that was taken out on this home.
Original Mortgage
$188,000
Interest Rate
7.7%
Mortgage Type
Purchase Money Mortgage
Purchase Details
Closed on
Oct 25, 2005
Sold by
Johnson Samuel K and Johnson Sonja K
Bought by
Hasebi Sheena L
Home Financials for this Owner
Home Financials are based on the most recent Mortgage that was taken out on this home.
Original Mortgage
$108,000
Interest Rate
5.87%
Mortgage Type
Purchase Money Mortgage
Purchase Details
Closed on
Dec 15, 1999
Sold by
Glencoe Llc
Bought by
Johnson Samuel K and Johnson Sonja K
Home Financials for this Owner
Home Financials are based on the most recent Mortgage that was taken out on this home.
Original Mortgage
$129,754
Interest Rate
7.82%
Mortgage Type
FHA
Create a Home Valuation Report for This Property
The Home Valuation Report is an in-depth analysis detailing your home's value as well as a comparison with similar homes in the area
Home Values in the Area
Average Home Value in this Area
Purchase History
| Date | Buyer | Sale Price | Title Company |
|---|---|---|---|
| Brown John | -- | Vanguard Title | |
| Brown John Lee | -- | Vanguard Title | |
| Brown John | -- | Gt Title Services Slc | |
| Brown John | -- | United Title Services | |
| Payne Matthew A | -- | Bonneville Superior Title | |
| Federal Home Loan Mortgage Corp | -- | Accommodation | |
| Aurora Loan Services Llc | $162,572 | Security Title Ins Agency | |
| Gonzalez Leah K | -- | First American Title | |
| Hasebi Sheena L | -- | Superior Title | |
| Johnson Samuel K | -- | First American Title Ins Co |
Source: Public Records
Mortgage History
| Date | Status | Borrower | Loan Amount |
|---|---|---|---|
| Open | Brown John Lee | $158,819 | |
| Closed | Brown John | $159,065 | |
| Previous Owner | Payne Matthew A | $133,429 | |
| Previous Owner | Gonzalez Leah K | $188,000 | |
| Previous Owner | Hasebi Sheena L | $108,000 | |
| Previous Owner | Johnson Samuel K | $129,754 |
Source: Public Records
Tax History Compared to Growth
Tax History
| Year | Tax Paid | Tax Assessment Tax Assessment Total Assessment is a certain percentage of the fair market value that is determined by local assessors to be the total taxable value of land and additions on the property. | Land | Improvement |
|---|---|---|---|---|
| 2025 | $1,625 | $382,200 | $63,300 | $318,900 |
| 2024 | $1,625 | $360,500 | $60,700 | $299,800 |
| 2023 | $1,697 | $360,400 | $59,500 | $300,900 |
| 2022 | $1,837 | $370,900 | $58,300 | $312,600 |
| 2021 | $1,481 | $263,800 | $48,600 | $215,200 |
| 2020 | $1,392 | $234,600 | $33,000 | $201,600 |
| 2019 | $1,376 | $224,000 | $33,000 | $191,000 |
| 2018 | $1,179 | $195,900 | $30,400 | $165,500 |
| 2017 | $1,091 | $182,800 | $30,400 | $152,400 |
| 2016 | $1,020 | $165,000 | $44,200 | $120,800 |
| 2015 | $1,189 | $174,600 | $45,100 | $129,500 |
| 2014 | $1,024 | $149,200 | $40,900 | $108,300 |
Source: Public Records
Map
Nearby Homes
- 1297 Glencoe Dr
- 1193 W Dun Robin Ct
- 1471 W 6170 S
- 1506 W 6235 S
- 6189 S Elderberry Ln
- 1429 Connie Way
- 903 W Bullion St
- 913 W Bullion St Unit 10
- 1273 W Brister Dr
- 1481 W Bluemont Dr
- 1501 W Bluemont Dr
- 1334 Portside Way Unit 165
- 5435 S Break Water Dr
- 5449 S Coastal Ct
- 5834 Walden Ridge Dr
- 1380 W Ocean Ct
- 1332 W Ocean Ct
- 1370 W Telegraph Hill Dr
- 1178 W Brandonwood Dr
- 1401 Beacon Hill Dr Unit 118
- 1277 W Glengyle Ct
- 1279 Glengyle Ct
- 1273 Glengyle Ct
- 1281 W Glengyle Ct
- 1281 Glengyle Ct
- 1283 Glengyle Ct
- 1283 W Glengyle Ct
- 1287 W Glengyle Ct
- 1287 Glengyle Ct
- 1289 W Glengyle Ct
- 1289 Glengyle Ct
- 1291 Glengyle Ct
- 6018 Hidden Place
- 1274 Glengyle Ct
- 1276 Glengyle Ct
- 1276 W Glengyle Ct
- 1278 Glengyle Ct
- 1274 W Glengyle Ct
- 1282 Glengyle Ct
- 1272 W Glengyle Ct